Welcome to Jedox Web, the unified platform for planning, analytics, and performance management. This Quick Start Guide is designed to help new users quickly become acquainted with the core capabilities of Jedox Web. Whether you're designing interactive reports, integrating diverse data sources, or automating tasks, this guide provides a step-by-step overview of the essential tools, features, and best practices. Everything you need to build powerful business applications — directly in your browser.
User roles and access levels
In typical Jedox usage, users are divided into two main groups: Power Users and End Users. As a new user, you will also belong to one of these categories.
-
Power Users create and maintain applications and content such as databases, Integrator projects, and reports. In the Power-User mode, the full functionality of Jedox is available, though specific components can be restricted through role permissions.
-
End Users interact with the applications created by Power Users. In the End-User mode, access is restricted to the 'Reports' component, shown through a user-friendly interface designed specifically for straightforward report viewing and interaction.
These modes are determined by the roles and rights assigned by the administrator, with each user group experiencing a different user interface (UI). User roles and permissions are configured in Administration > Roles.
Note that a user's license determines their interface mode more than their role rights. Users with "Web Viewer," "Web Planner," or "Jedox Planner (Web + Excel)" licenses will always see the end user mode, regardless of assigned roles.
To make this guide helpful for both power users and end users, section headings are color-coded: green indicates content relevant to power users, while Blue highlights sections intended for end users.
 Navigating the Jedox Web homepage Power Users End Users
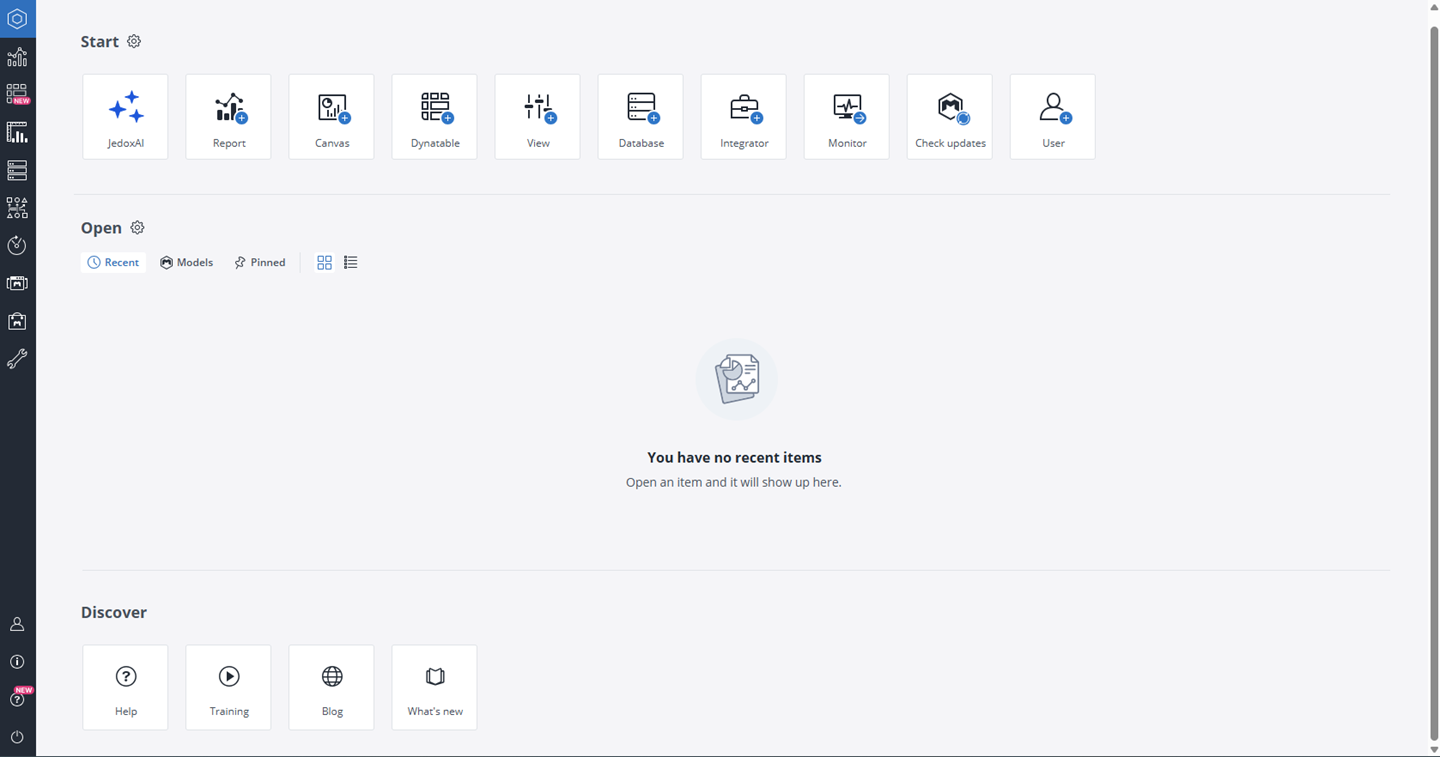
After logging in, you'll arrive at the Jedox Web homepage, which features the main sections (Start, Open, and Discover), and the navigation panel on the left.
-
Start: Quick access to components like Reports, Canvas, Dynatables, Views, Modeler, Integrator, and more.
-
Open: Displays recent, pinned, or model-related items.
-
Discover: Offers shortcuts to Jedox Knowledge Base, Jedox Academy, Jedox Blog, and Jedox Release Notes.
Note that you can use CTRL + H to return to the homepage at any time.
Navigation panel
The left-side navigation panel on the Jedox homepage offers quick access to the platform’s core features. Below is a list of all available navigation options and shortcuts you can use to open them.
| Icon | Name | Shortcut | Description |

|
Homepage | Ctrl + H
|
Shortcut access to various Jedox Web components. |

|
Reports | Ctrl + R
|
Access published reports and dashboards. |

|
Dynatables | Alt + T (Windows) or Option + T (Mac) |
Create flexible, pivot-style tables for dynamic reporting. |

|
Designer | Ctrl + D
|
Create, design, and manage spreadsheets which can serve as reports, dashboards, data entry sheets, and more. You can also manage other files within the platform. For more information, see the article Jedox Spreadsheet Basics. |

|
Modeler | Ctrl + P
|
Design and manage multidimensional databases. |

|
Integrator | Ctrl + E
|
Set up data integration projects for importing/exporting data (for example from source system such as data warehouses.) |

|
Scheduler | Ctrl + K
|
Schedule tasks like report and PDF generation or data integration jobs. |

|
My Models | Ctrl + G
|
See the installed Models and update them. |

|
Marketplace | Ctrl + U
|
Access all available Models for Jedox. |

|
Administration | Ctrl + M
|
Manage users, roles, and system settings. |

|
User settings | Ctrl + O
|
Customize personal settings and preferences. |

|
About Jedox | Ctrl + I
|
Displays the installed Jedox version. |

|
Help | F1
|
Access the Jedox Knowledge Base and online help resources. |

|
Logout | Ctrl + L
|
Log out of your account. |
Creating your first report with Jedox Views or Dynatables Power Users End Users
Jedox provides two powerful reporting tools: Jedox Views and Dynatables. Any report you create using these tools is directly based on your database.
Jedox View Power Users
Jedox Views enable you to display and interact with data stored in a Jedox OLAP database. Typically used within spreadsheets (like Jedox Web or Excel), Views allow you to analyze, explore, and manipulate large datasets efficiently. While they offer strong capabilities for filtering, drilling down, and reorganizing data, they are designed to work within the structure of a spreadsheet grid.
Building a Report with a Jedox View
-
Open Designer: Navigate to the Designer component or use
CTRL + D. -
Create New spreadsheet: Click on "New" and select "New spreadsheet."
-
Insert View: Open the "Query" menu and select "New View."
-
Configure View: Choose the desired database and cube and arrange dimensions by dragging and dropping them into the POV, Rows, and Columns.
-
Paste View: Click "Paste" to insert the configured view into your spreadsheet.
When your report is ready, click on File > Publish. Here, you can select the Group, Hierarchy, and name for your report. This step is crucial, as it determines where your end users can find and view the report.
To get started with the Add-in for Excel 365, click here.
Dynatables Power Users End Users
Dynatables are a newer, more flexible way to create and manage In-Memory DB Views outside of spreadsheets. They can be found directly in Jedox Web, have a simplified UI, and are faster and easier for users who don't need full spreadsheet functionality. Dynatables are designed for quick exploration, lightweight reporting, and simple access to data. They are ideal if you want fast insights without setting up a full spreadsheet.
Creating a Report with Dynatables
-
Open Dynatables: Press
Alt + T(Windows) orOption + T(macOS) to open the Dynatables interface. -
Create New Dynatable: Click "Create Dynatables." (This option is available if you have at least "W" access rights for the sub-set view.)
-
Select Database and Cube: Choose the desired database and cube.
-
Customize Dynatable: Drag and drop dimensions into POV, Rows, and Columns.
-
Element Selection: Search and select specific elements or aliases within dimensions.
-
Zero Suppression: Hide rows or columns with zero values to enhance readability.
-
Data Entry: If write-back is enabled, input and update values directly within the Dynatable.
-
-
Save Dynatable: After customization, click "Save" or use "Save As" to create a duplicate with a new name or ID.
You can also quickly build and update a Dynatable with the help of JedoxAI.
Build your custom dashboard with Canvas Power users
Jedox Canvas is a creative space for building fully interactive, tailored dashboards that bring together data, visuals, and user input in one cohesive layout. Whether you’re monitoring KPIs, analyzing trends, or enabling guided planning, Canvas allows you to design interfaces that fit your exact business needs.
-
Create a New Canvas:
-
From the Start Page: Click on the Canvas button.
-
From Designer: Navigate to your desired folder, click "New", and select "New Canvas".
-
Within an existing workbook: Right-click on the sheet tabs at the bottom and choose "New Canvas".
-
-
Add components to Canvas: Drag and drop components from the Canvas Native Components, or Web Spreadsheet workbooks.
-
Canvas inspector: The Canvas inspector panel on the right size of the screen helps you to customize each component:
-
Formatting: Set names, dimensions, padding, and background colors and adjust fonts, colors, and alignment to match your design preferences.
-
Data Settings: Define data sources, apply filters, and link variables.
-
-
Save and Share Your Canvas:
-
Save: Regularly save your work to prevent data loss.
-
Export: Use the File tab to export your Canvas as a PDF for distribution.
-
Publish: Make your Canvas available to end-users by publishing it to the desired folder or group.
-
Build your custom spreadsheet report with Form Elements Power Users
Jedox Web allows the addition of interactive form elements to reports:
-
Combobox: Dropdown selection linked to dimensions or data sources.
-
List: Multi-selection lists for filtering data.
-
Checkbox: Toggle options for binary choices.
-
Button: Trigger actions like recalculations or data submissions.
-
DatePicker: Select dates for time-based filtering.
-
Label: Display static text or dynamic values.
These elements can be inserted via the Insert tab in the Designer.
Actions in JedoxPower Users
Jedox offers a wide selection of customizable "Actions," which can be defined for the spreadsheet form elements, or for Canvas components. Adding an Action to a form element or Canvas component, allows the report users to execute a specific operation by clicking on the respective form element or component. The following are some of the available actions in Jedox Web settings. For a comprehensive overview, see Jedox Web Actions.
- Add/delete element: creates or deletes an element with a click
- Close: closes the current workbook (execution of this Action is disabled in User Preview mode)
- Download downloads a file
- Export Report: enables the end user to export a report
- Logout: logs the user out of Jedox (execution of this Action is disabled in User Preview mode)
- Upload: uploads a file to Jedox Web Designer. Note that access to Jedox Designer is currently required for full functionality.
Customizing Settings Power Users
Administrators can tailor Jedox Web settings via Administration > Settings. The following are some of the features available in Jedox Web settings. For a comprehensive overview, see Jedox Web Settings.
-
Login Page: Customize logos and background colors.
-
Studio Banner: Display announcements post-login.
-
Spreadsheet Settings: Configure cache settings and chart color palettes.
-
SMTP Settings: Set up email servers for notifications.
-
Feature Rollout: Enable or disable rollout features.
Check out some relevant articles for Quickstart with Jedox Web
The Jedox Ribbon serves as the primary navigation bar in Jedox, providing users with a structured interface to access essential tools and functionalities.
The Settings section of the Administration component in Jedox Web enables administrators to modify various Jedox Web settings, and add / delete new settings for their Jedox environment.
Dynatables enable you to create and access In-Memory DB Views directly within Jedox Web, independent of Jedox Web Spreadsheets.
Jedox Spreadsheet is a browser-based tool like Excel, but with added features to read, write, and report directly from the Jedox In-Memory DB.
The Modeler is a core component of Jedox Web that lets you define and manage the multidimensional structures used in planning and reporting. You can open it from the sidebar by clicking on Modeler.
Jedox Integrator is used to extract, transform, and load data (ETL) from external systems into Jedox or other targets.
The Jedox OLAP HTTP API enables applications to communicate with the Jedox OLAP Server. This article provides an overview of the API, its structure, and the available request types.
Updated June 17, 2026