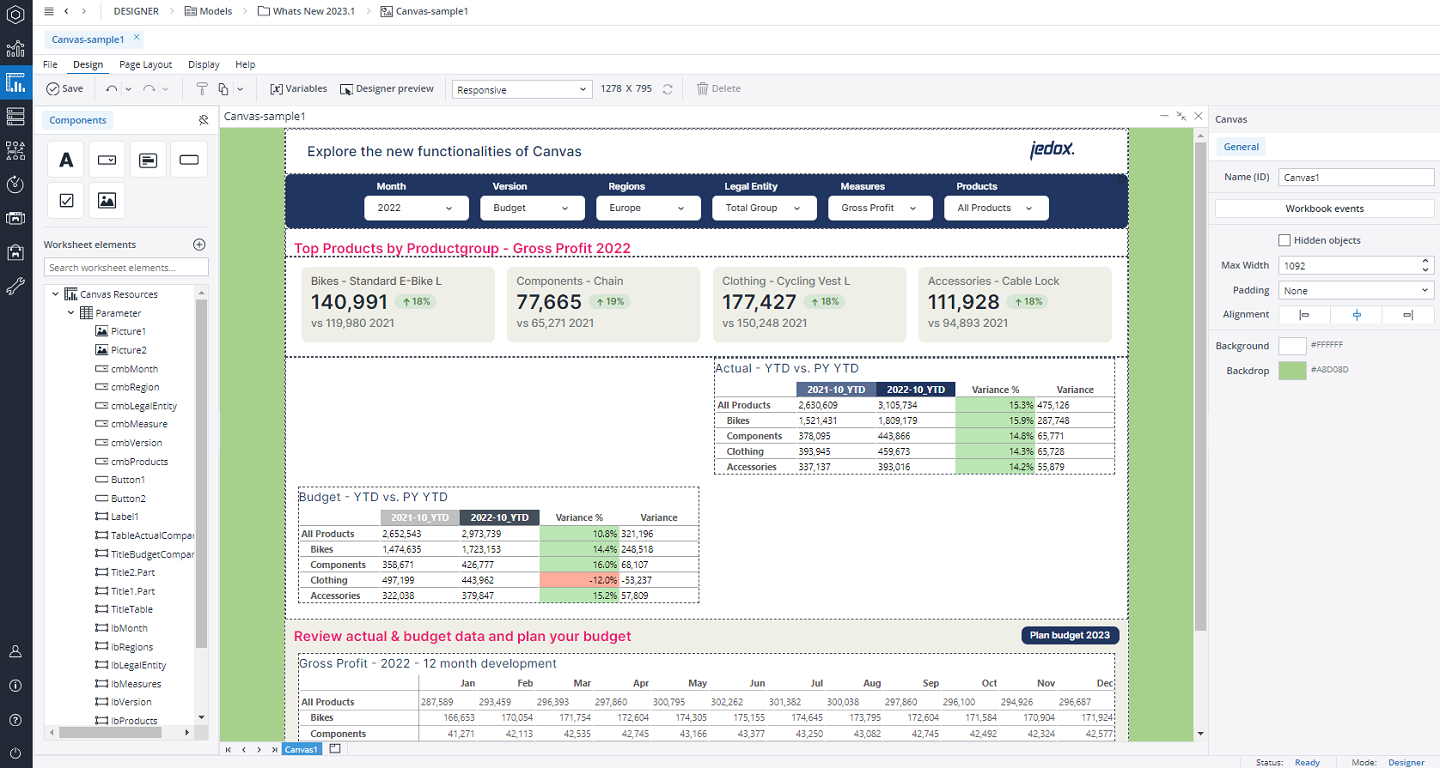
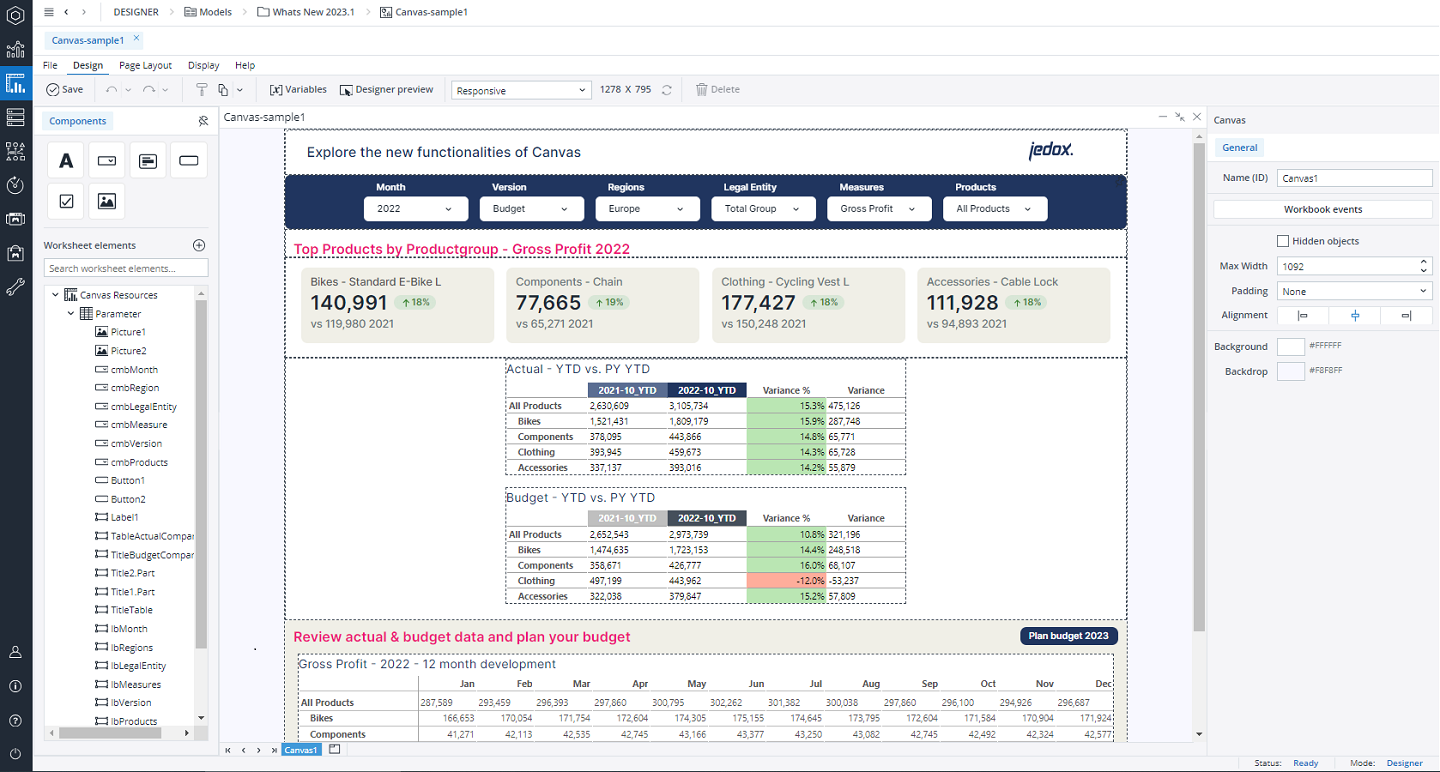
Jedox Canvas is a responsive, free-scrolling, and interactive pinboard for Jedox visualizations, views, actions, and more. With Jedox Canvas, you can combine your content from different business functions in one place and get a complete visual overview of your comprehensive planning and analysis activities.
Canvas reports are built using content from Canvas Native Components menu, or one or more Web Spreadsheet reports which are added to the Canvas with a simple drag-and-drop interface. Layout and formatting options within the Canvas Report Designer further allow you to create highly visual, responsive, and interactive reports.
Responsive layout and automatic resizing
You can design the layout of your Canvas report by positioning the content into stacks and groups, arranging it in rows or columns, and adjusting the alignment.
Each stack section has properties to control the alignment and flow direction (rows or columns) of the components within it. (See Canvas Layout) This enables you to easily control the layout behavior of components on a Canvas report.
A Canvas report also flexibly reacts to varying screen sizes and repositions content as the screen size changes. Stacks and content Frames are automatically resized based on content changes, such as expansion/contraction of a DynaRange or stored View.
Canvas terminology
-
Canvas: the interactive pinboard (or the "container" for the components) which is used to visualize your Jedox data is called a Canvas.
-
Stack: inside a Canvas, content components are grouped into Stacks. Each stack has properties for its size, layout, and the positioning of content inside it.
-
Group: when you drag an component close to or on top of an existing component, you will create a group.
-
Components: Labels, Comboboxes, KPIs, Buttons, Checkboxes,Images, Dynatables, and worksheet elements within your Canvas and source Web Spreadsheet workbook are called components.
-
Canvas worksheet tabs: Canvas workbooks can contain one or more worksheets. When inside an existing Canvas workbook, you can see all your Canvas worksheet tabs in the lower left side of the screen.
-
Canvas Properties Inspector: the Canvas Inspector panel enables you to define the layout of a Canvas. Depending on the component you choose, the Properties Inspector shows different menus.
-
General: this panel enables you to define the layout of a Canvas. You can define a Name (ID), Max Width, Padding, Alignment, and Background color for your Canvas. The Hidden objects option enables you to show or hide the hidden components within a Canvas. This option is unchecked by default, and the hidden components are invisible. To be able to see and edit the hidden components, you should check this option. The Backdrop fill option is used when the Max Width is applied. It provides better style control and demarcates the Canvas report area for the end users.

-
Format: this tab enables you to edit properties such as name, width, height, padding, and margin.
-
Data: this tab enables you to define the data you want to show on your component.
-
Next step: Creating a Canvas
Updated November 27, 2025
