To add Web Spreadsheet workbooks to your Canvas, select Add Workbook from the Components section.

In the following tab, you can select one or more source workbooks to use within your Canvas.

All Canvas components, such as sheets, charts, images, and form elements (combobox, Label, etc.) within your source Web Spreadsheet workbooks will be listed. You can drag and drop each of these components onto your Canvas.

Note that the workbook components you add to your Canvas rely on the corresponding sheet's name for content retrieval. If you change the name of a sheet in the workbook, the connection between the component and the sheet will be broken. In this case, you must use the Inspector to replace the components on your Canvas.
Searching worksheet elements
When there are many components in your Web Spreadsheets, you can use the Add Component menu’s search bar to quickly find the component you need.

Changing the content of the source workbook
You can also quickly and easily open and change the source content of a Web Spreadsheet workbook from inside a Canvas. To do this, right-click on the worksheet in the Content Source list of the Canvas and select Go to Source.

Workbook components visibility
By default, the visibility of Web Spreadsheet workbook components is an Expression with the value "=TRUE", but you can use a variable or another Expression, e.g., FALSE, to change (hide) it. When you hide a workbook component, the remaining components dynamically adjust to occupy the vacant space. If you wish to maintain the hidden workbook components space and preserve your Canvas layout, you can utilize the Keep space option.
Executing Macros
You can only execute the macro of a form element if the macro is in the same workbook as the Canvas. Executing the macros of form elements from other workbooks is not currently supported.
Naming worksheet elements
To prevent confusion when building a Canvas with many worksheet elements, it is best if you define specific names for the worksheet elements (charts, images, etc.) in the Jedox Web Spreadsheet. This lets you quickly identify the worksheet elements you wish to add to your Canvas.
You can define worksheet elements names in two ways. First, change the default name when building a worksheet element (for example, a chart). Second, once the worksheet element is built, right-click on it and change its name in the properties menu. (See Naming Web Spreadsheet Objects)


Adding frames inside a Web Spreadsheet
To add Web Spreadsheet cell contents to a Canvas, for example, an intricate KPI layout, you must first define the area using a frame. Frames (or a named range with its scope set to a specific worksheet) enable you to mark an area of a worksheet that can cover multiple cells and worksheet elements. Frames you have added to your spreadsheet will be listed in the Canvas worksheet elements list.
To add a frame to your spreadsheet, choose the content you want to add and then click on frame in the Insert menu of the Jedox ribbon.

You can provide a label and name for the new frame. These identifiers should be meaningful and unique, so that you can easily identify them in the frame list later. You can specify a size for the frame in the dialog, or click OK and drag the green frame around the area you want to identify.

When the underlying content of a Canvas is changed, e.g., expansion or contraction of a DynaRange, changes in a stored View, inserting or deleting rows, resizing rows and columns, then the Stacks and frames are automatically resized.
Note that the spreadsheet objects (frames, charts, etc.) that are used in a Canvas should not overlap. Furthermore, it is essential to arrange these objects in a way that their edges do not overlap concurrently in both rows and columns. The example below shows some correct and incorrect arrangements.

Note that if you want to capture a DynaRange completely, you must use a frame object. In addition, when a DynaRange exists in the source Web Spreadsheet of a Canvas frame, changes to the frame content are not updated automatically when switching between the source workbook and the Canvas. To display the updates, both the source workbook and the Canvas workbook must be closed and reopened.
Furthermore, when a frame contains two nested Dynaranges, the subset of the inner Dynarange can only be recalculated (for example, after a change to a dependent combobox) if the outer Dynarange has not been recalculated beforehand. If the outer Dynarange is refreshed first, subsequent recalculation of the inner Dynarange will no longer function as expected.
Hiding frames
To temporarily hide the frames in your worksheet, uncheck the “Frames” checkbox in the Display menu.

Frames size limits (Min/Max)
In WSS, frames do not have a defined maximum size and can extend up to 6000 pixels by 6000 pixels. When you add a frame to the Canvas, it will display at its original size from your WSS. However, if you apply Freeze panes in Canvas, the frame size will be limited to 1600 pixels by 1600 pixels.
Freeze panes
The Freeze Panes feature allows you to lock specific rows and columns of a frame so that important data remains visible while scrolling within the Canvas. This is useful when working with large tables where headers or key reference columns should stay in view while navigating through the data.
Open your worksheet and add the required frames to your Views or data. After the frame is created, open the Canvas. Click Add Component and drag the frame from the Worksheet elements section and drop it onto the Canvas. When the frame is selected on the Canvas, the Freeze panes option becomes available in the General tab on the right-hand side.
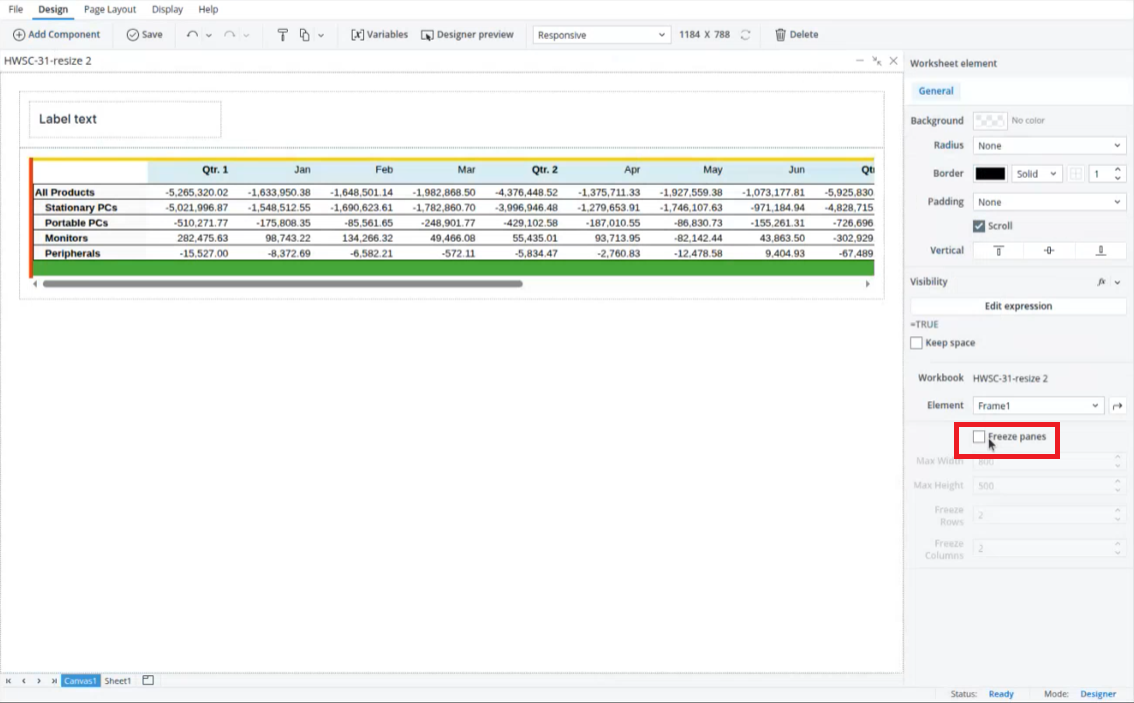
When Freeze panes is enabled, four configuration options become available: Max height, Max width, Freeze rows, and Freeze columns.
-
Max height and max width: You can set your frame's maximum dimensions on your canvas by configuring a maximum width and height. The maximum width limit is 1600 pixels and the maximum height limit is 1200 pixels.
-
Frozen rows: This option allows you to specify the number of top rows to keep locked in place; this is typically used to keep headers or summary rows visible. You can freeze one or more rows at the top and these rows remain visible while scrolling vertically.
-
Frozen columns: This option allows you to specify the number of leftmost columns to freeze, keeping key identifiers such as account names or dimension labels visible while navigating across the frame. You can freeze one or more columns on the left side and these columns remain visible while scrolling horizontally.
For a practical example of the Freeze Pane feature, watch the Freeze Pane in Canvas video.
Additional information
-
Defining a maximum width is not required for column freezing. If no maximum width is specified, horizontal scrolling and column freezing are automatically activated when the frame width exceeds the browser window width. However, this requires the Scroll option to be enabled either on the Frame itself or on a surrounding Group. If Scroll is not enabled, scrolling is applied to the highest-level Stack containing the Frame, causing the entire Stack to scroll instead.
-
Defining a maximum height is required for row freezing to take effect. This is because a Canvas report automatically grows vertically to fit its content and uses a single scrollbar for the entire page. For vertical scrolling and row freezing within a frame to occur, a fixed height must be defined for that frame.
-
When specifying the number of rows and columns to freeze, partially visible rows and columns at the top and left edge of the frame are also counted. In addition, hidden rows and columns are included in the count.
-
If the frozen area of a worksheet frame contains floating objects such as combo boxes or checkboxes, these objects are not frozen when scrolling. They will continue to move with the rest of the frame content.
-
Merged cells are ignored when counting columns. For example, if a horizontally merged cell spans three columns in the area to be frozen, the Freeze columns value must still be set to 3, not 1. If a merged cell crosses the boundary of the frozen area, the part of the cell on the left side of the boundary remains frozen, while the part on the right-side scrolls.
-
In PDF exports, if a maximum width or height is defined for a frame, the exported PDF will currently display only the content within those limits. Any content outside the defined maximum width or height is not included in the PDF output.
-
When the feature flag
features.rollout.canvas_freeze_paneis disabled, frames with freeze or maximum size settings configured will no longer exhibit freeze behavior. However, the settings themselves are preserved. When the feature flag is enabled again, the previously defined settings automatically take effect without requiring any reconfiguration.
Deleting workbooks and components
To delete a workbook from the worksheet elements list, right-click on the workbook, and select Remove Workbook.Note that you can only remove a workbook from the list if it is unused, i.e., there are no objects from it on the Canvas.
When you delete any Web Spreadsheet content (charts, comboboxes, frames, etc.), it will be automatically deleted from your Canvas too. In this case, an icon on your Canvas replaces the deleted content, providing a visual indicator for proper actions.

Editing Components in a Canvas
Once you have positioned your components onto your Canvas, you can still edit them in many ways. You can move them around by dragging and dropping them. You can also undo/redo your formatting and component placements or copy/cut and paste your components, frames, and stacks.
Next step: Canvas Layout
Updated July 3, 2026