Jedox Views help you to quickly show and analyze data from Jedox cubes in a spreadsheet in Excel or Jedox Web.
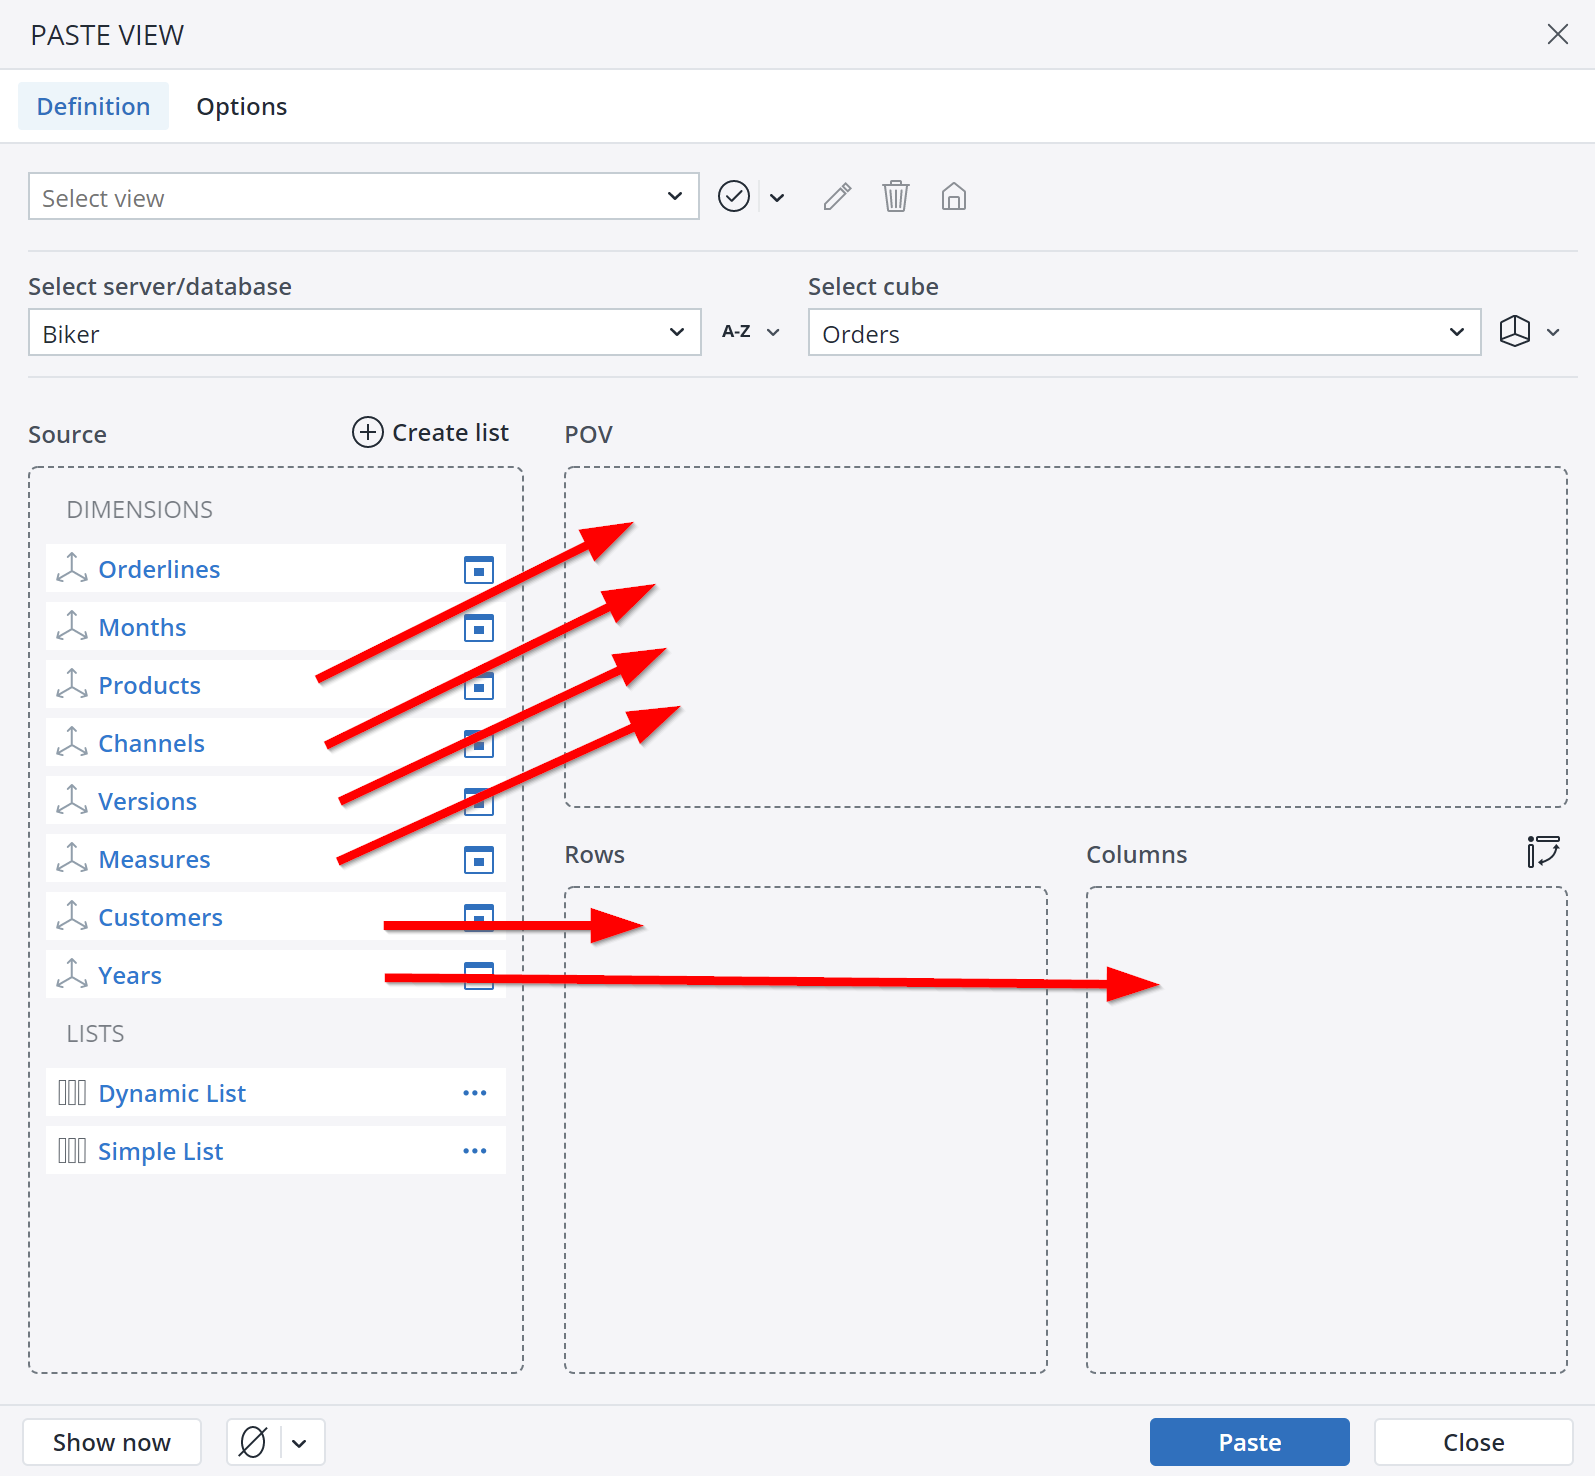
With a spreadsheet open, click New View on the Jedox ribbon in Excel or Query > New View in a Jedox Spreadsheet to open the Paste View Dialog window.
Select the database and the cube you want to use for the View.
You can customize the data display by selecting the dimensions and elements you want to see and deciding how they should be arranged. To customize the display, drag and drop dimensions from the Source area to the page headers area (POV), the Row titles area, or the Column titles area.
To receive the next screenshot please do following adjustments:
- Select the database Demo and the cube Sales.
- Drag and drop the Products dimension to the area Rows.
- Drag and drop the Regions dimension to the area Columns.
- Drag and drop Months, Years, Versions, and Measures to POV.
- In POV click the button on Months and select Jan, the button on Years and select 2018, the button on Versions and select Actual. Units is automatically selected for Measures.
Now click on the Paste button and then double-click on B11 and C9 in the created View to expand the elements.
In Views with multiple dimensions within a row or column, if the outer dimension displays multiple elements, these two options can be applied when expanding elements of the inner dimension:
-
Expand the inner element for a single element of the outer dimension.
-
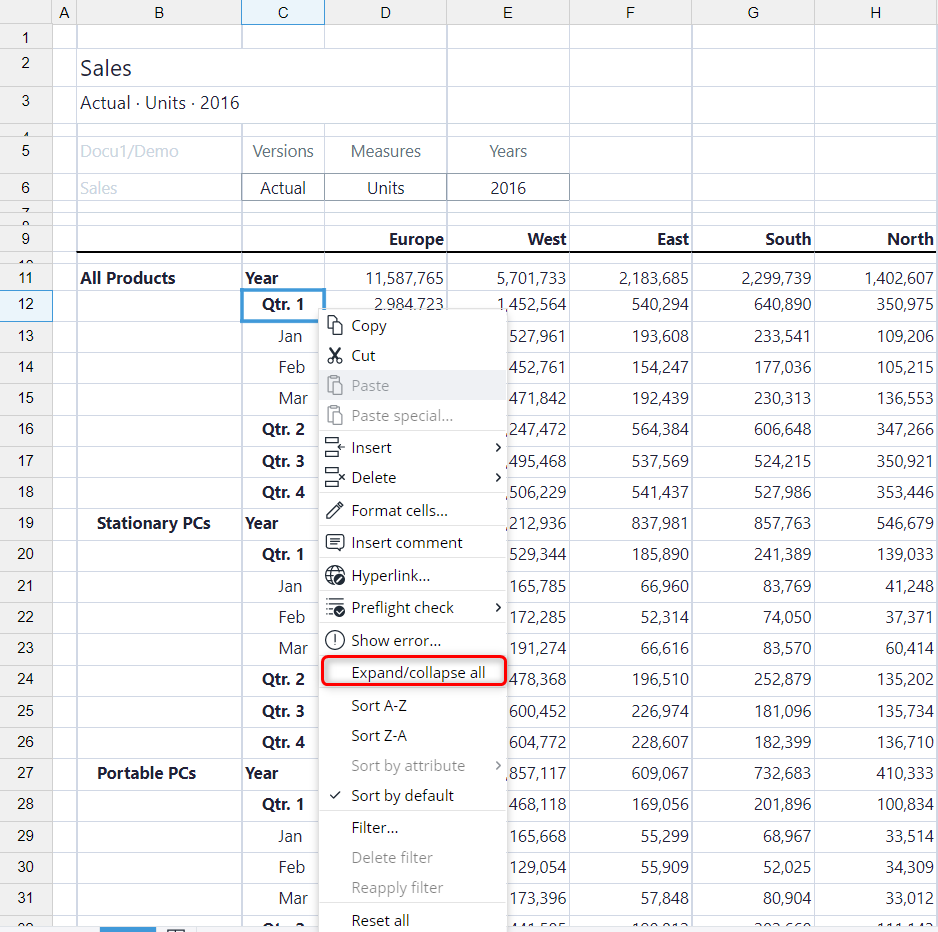
Expand the inner element for all occurrences, i.e., for all elements of the outer dimension, by right-clicking on an element of the inner dimension and selecting Expand/collapse all.
The second option cannot be applied in Views with only one dimension in the row or column, nor can it be applied to the outermost dimension.
Description of the Jedox View above:
| Cell address | Name | Description | Option / Functionality |
| B2 | Title | Title is the name of the Stored View. If the View is not stored, title is the name of the used cube. | Option to hide whole row in tab "Options" of dialog "Edit View": Hide title. If Allow pivot is checked in Paste View Options, then double-clicking Title opens Paste View dialog. |
| B3 | Subtitle | A concatenation of the element names which are selected in header dimensions (C6:F6), separated by a bullet point. | Option to hide whole row in tab "Options" of dialog "Edit View": Hide subtitle. |
| B5 | Database | Combination of connection and database name. | Can be hidden with headers option. |
| B6 | Cube | Name of the used cube. | Can be hidden with headers option. |
| C5:F5 | Header dimensions | The dimensions of the used cube which were left in POV. | Option to hide the whole rows 5 and 6 in tab "Options" of dialog "Edit View": Hide headers. |
| C6:F6 | Selected header dimension elements | The selected dimension elements of the dimensions which were left in POV. | Option to hide the whole rows 5 and 6 in tab "Options" of dialog "Edit View": Hide headers. |
| Column B starting with B11 |
Row titles | Row titles of the displayed rows. | Double-click on consolidated elements (displayed with bold characters) will expand / collapse child elements. |
| Row 9 starting with C9 |
Columns titles | Column titles of the displayed columns. | Double-click on consolidated elemenets (displayed with bold characters) will expand / collapse child elements. With right-click on the head cell of a column you receive sort commands. |
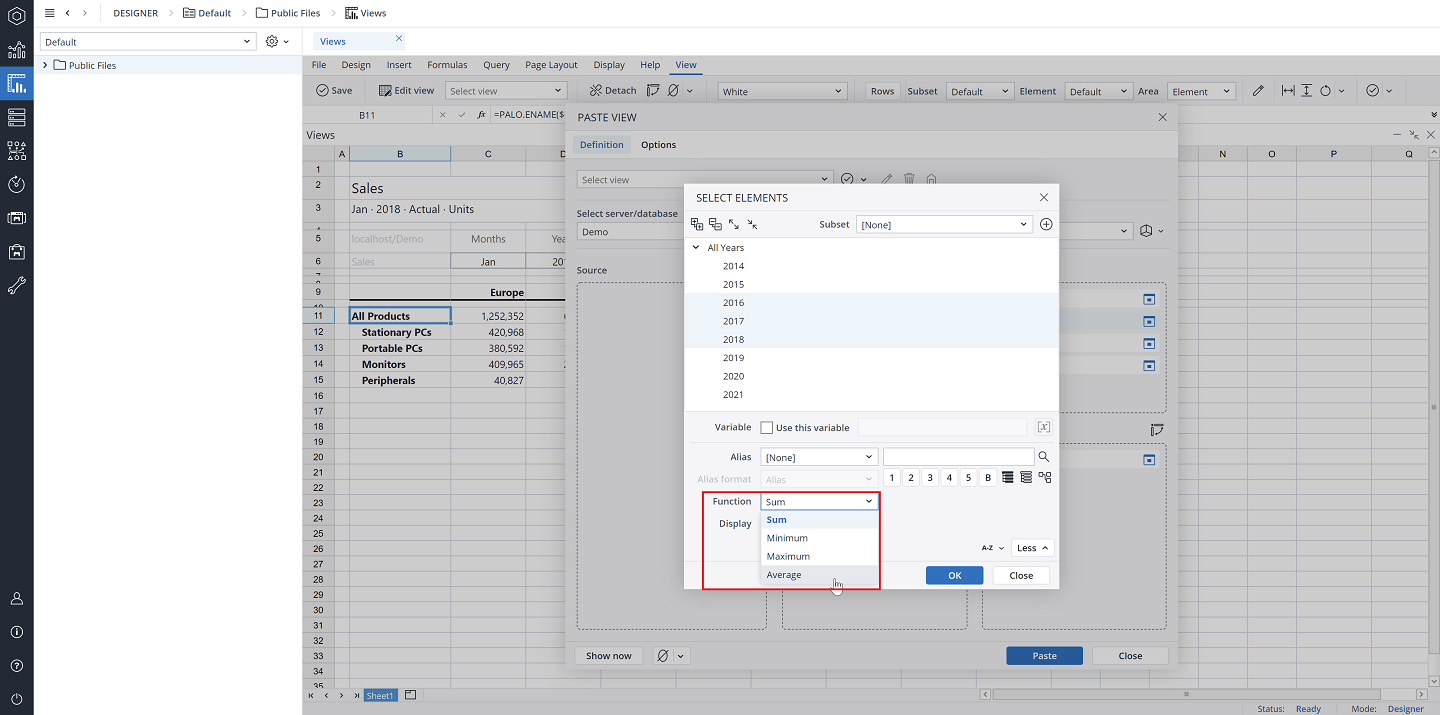
It is possible to select multiple elements in the page headers area (cells C6:F6). For example, in the screenshot below, we selected in cell D6 the years 2016, 2017, and 2018:
After selecting multiple elements, you can select among the aggregation functions Sum, Minimum, Maximum, or Average. Note that these functions operate after any cell calculations that are required for the View.
| Sum | The default aggregation type; it calculates the sum of the selected elements in the current View. |
| Maximum | Shows only the highest value from selected elements in the current View. |
| Minimum | Shows only the smallest value from the selected elements in the current View. |
| Average | Calculates the average value of the selected elements in the current View. |
If multiple elements have been selected, Drill Through and Drill History are not possible.
To continue our example from above, we applied the Average function to our selection and received the following Jedox View:
The View now displays the average of units in January for the years 2016, 2017, and 2018. Such calculations are also known as aggregation functions and ad hoc client-side rules.
Important: due to a constraint in Excel, copying or moving a sheet containing a View to another workbook can lead to corrupted data (custom sheet properties are lost, which leads to missing XML). As a workaround, we recommend to manually create a new workbook by going to File > New and use that as a target for the sheet you want to move / copy.
Notes:
- Jedox Views use both the name of the dimension and the internal dimension ID when defining a View. Thus, if the cube layout is changed, or the dimension is renamed, Views continue to work.
- When opening a spreadsheet file which contains a View created in an old Jedox layout or theme, the View will be automatically converted to the new layout in Excel Add-in. In Jedox Web, however, the conversion is not automatic. Instead, it is necessary to open the "Edit View" dialog once and paste the View again from there.
- When pasting a View in the Excel Add-in using the PALO.DATAV data function, the number of supported dimensions in the POV section is reduced to approximately 6-10 dimensions (depending on the length of the element names). This is due to a bug in MS Excel (FormulaArrays support up to 255 characters). After pasting the View, usually the first cell of the View is displayed, which can be used to manually recreate the array formula in four steps and overcome this issue:
- Make sure the whole View data area is selected
- Press F2
- Delete the @ symbol of the formula
- Press CTRL-SHIFT-ENTER
- To learn more about building custom reports with changed formats and differently positioned contents, please read Detaching Jedox Views.
Updated July 3, 2025


