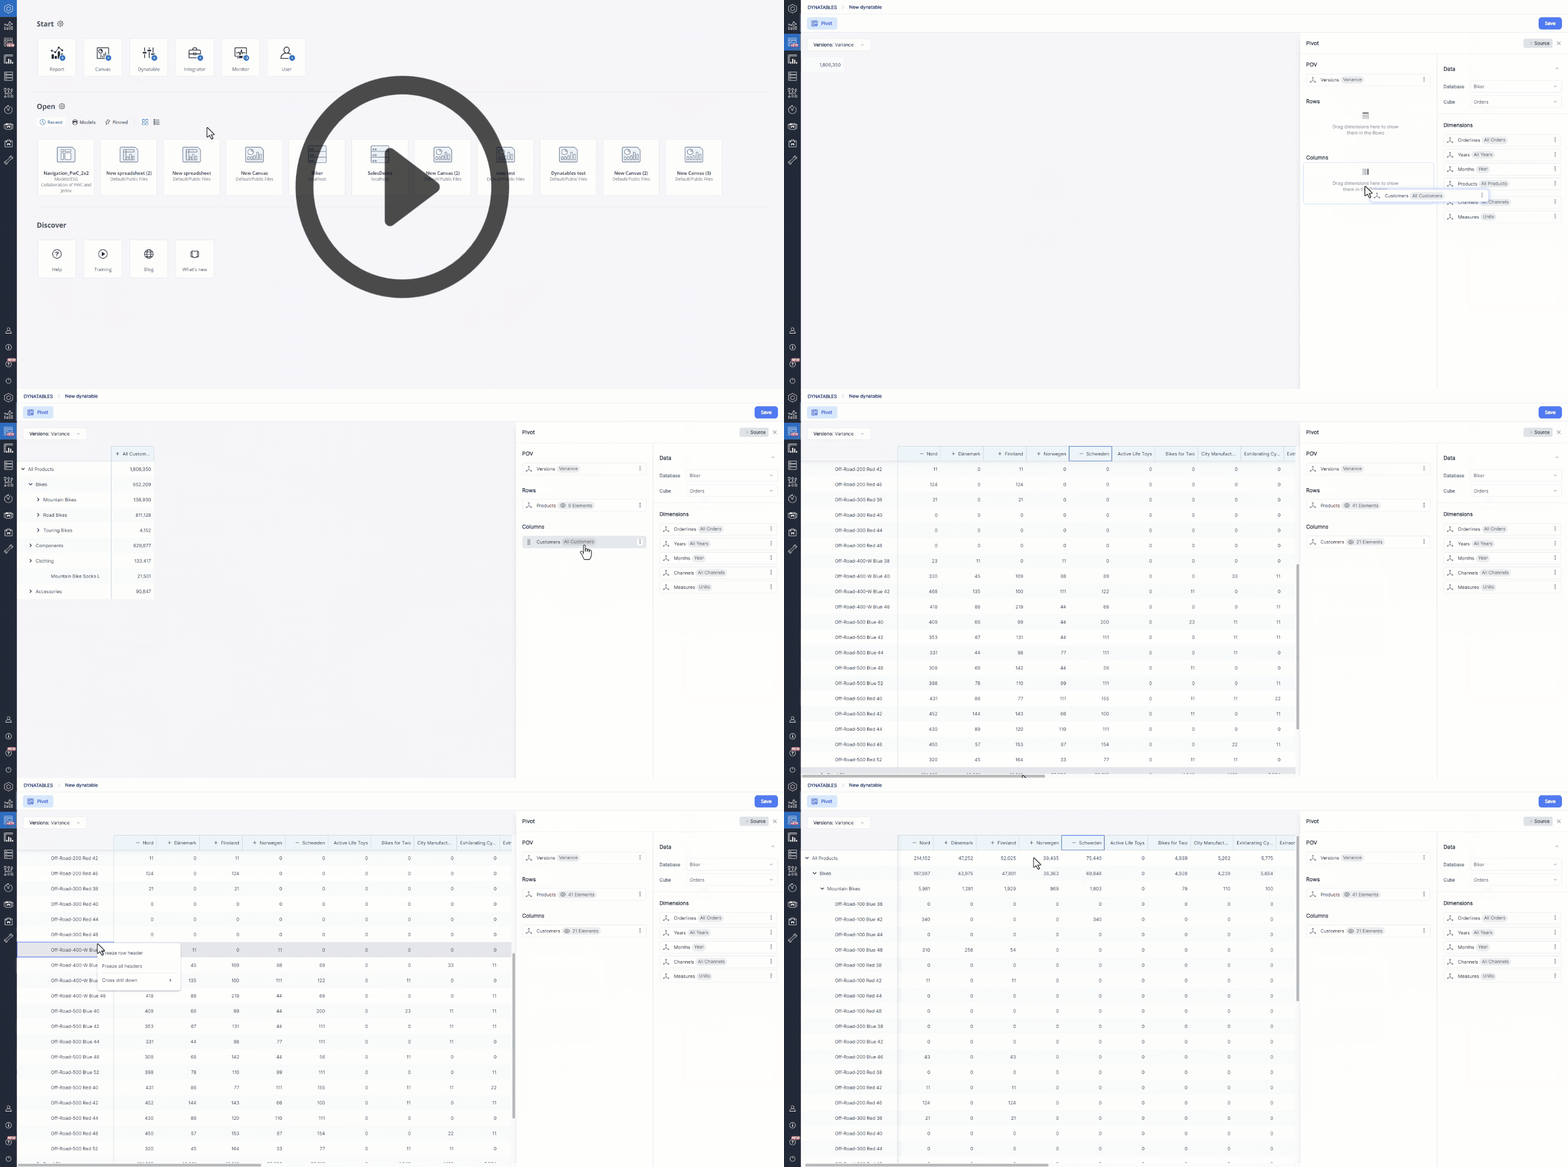
Dynatables enable you to create and access In-Memory DB Views directly within Jedox Web, independent of Jedox Web Spreadsheets. Featuring an intuitive user interface (UI), Dynatables ensure that users across various roles can harness the full potential of Jedox's analytical capabilities. Whether you are a novice user exploring data or an experienced analyst crafting sophisticated reports, the ability to create and manipulate Dynatables empowers you to gain valuable insights and tailor your data analysis to meet specific business needs.
The smooth integration of Dynatables within the top-level navigation of Jedox Web, alongside essential sections like Reports, Designer, and Modeler, ensures an efficient user experience. This accessibility is further enhanced by convenient keyboard shortcuts—simply press Alt + T on Windows or Option + T on macOS to open Dynatables instantly.
Note that the different components of Dynatables are keyboard-accessible. For details, see Dynatables Keyboard Shortcuts
You can enhance your Jedox Dynatables with JedoxAI. For detailed guidance on using AI features in Dynatables, refer to the article JedoxAI User Guide .
Creating new Dynatables
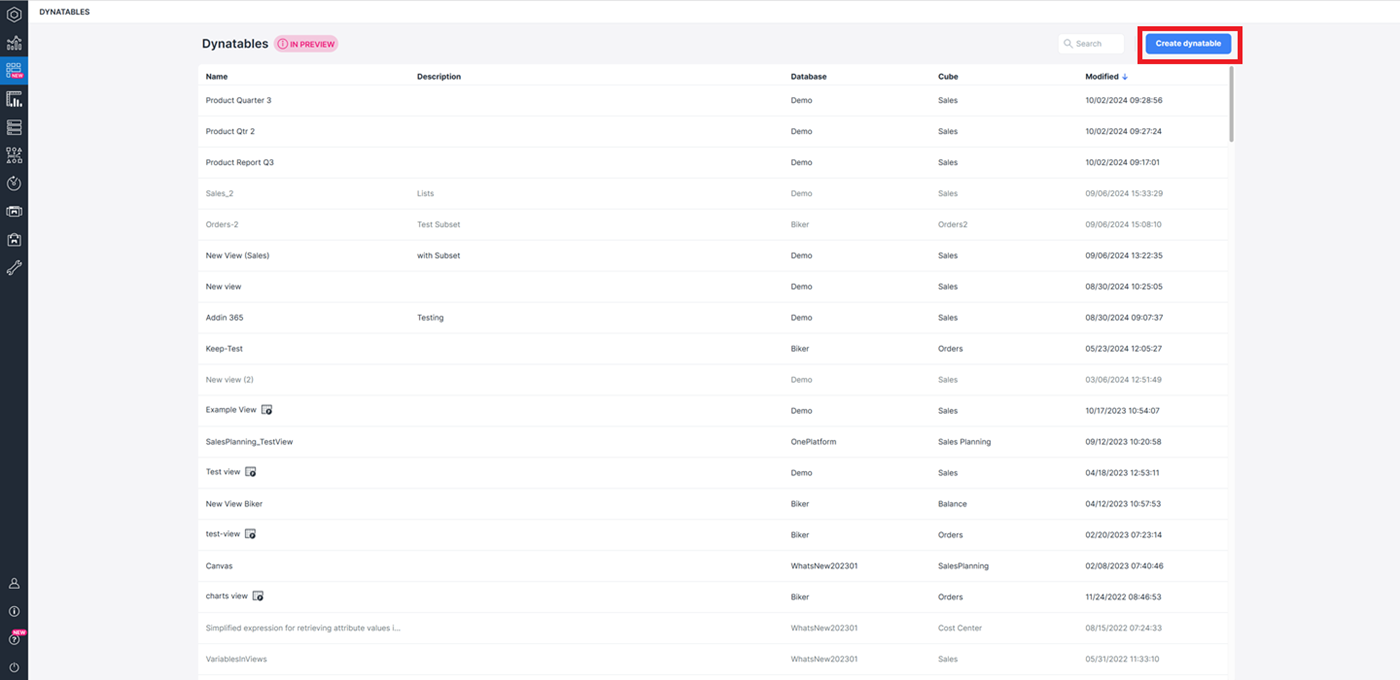
If you have the minimum access rights of "W" for the sub-set view, you can see a "Create Dynatables" button in the new Dynatables section.
By clicking this button, you will be able to select a database and cube, and see the dimensions that are part of the selected cube inside the Dynatables. You can then customize your Dynatables by dragging and dropping the dimensions into the different sections of your Dynatables.
Notes:
-
Lists and Virtual Dimensions are currently not displayed in the Source or POV section while creating a Dynatable.
-
When you open the Cube dropdown in the Source section, any cubes containing empty dimensions will be hidden, making them unavailable for selection.
-
The current maximum limit for elements supported in Dynatable creation is 100,000. This limitation will be increased in the near future.
Opening existing Dynatables
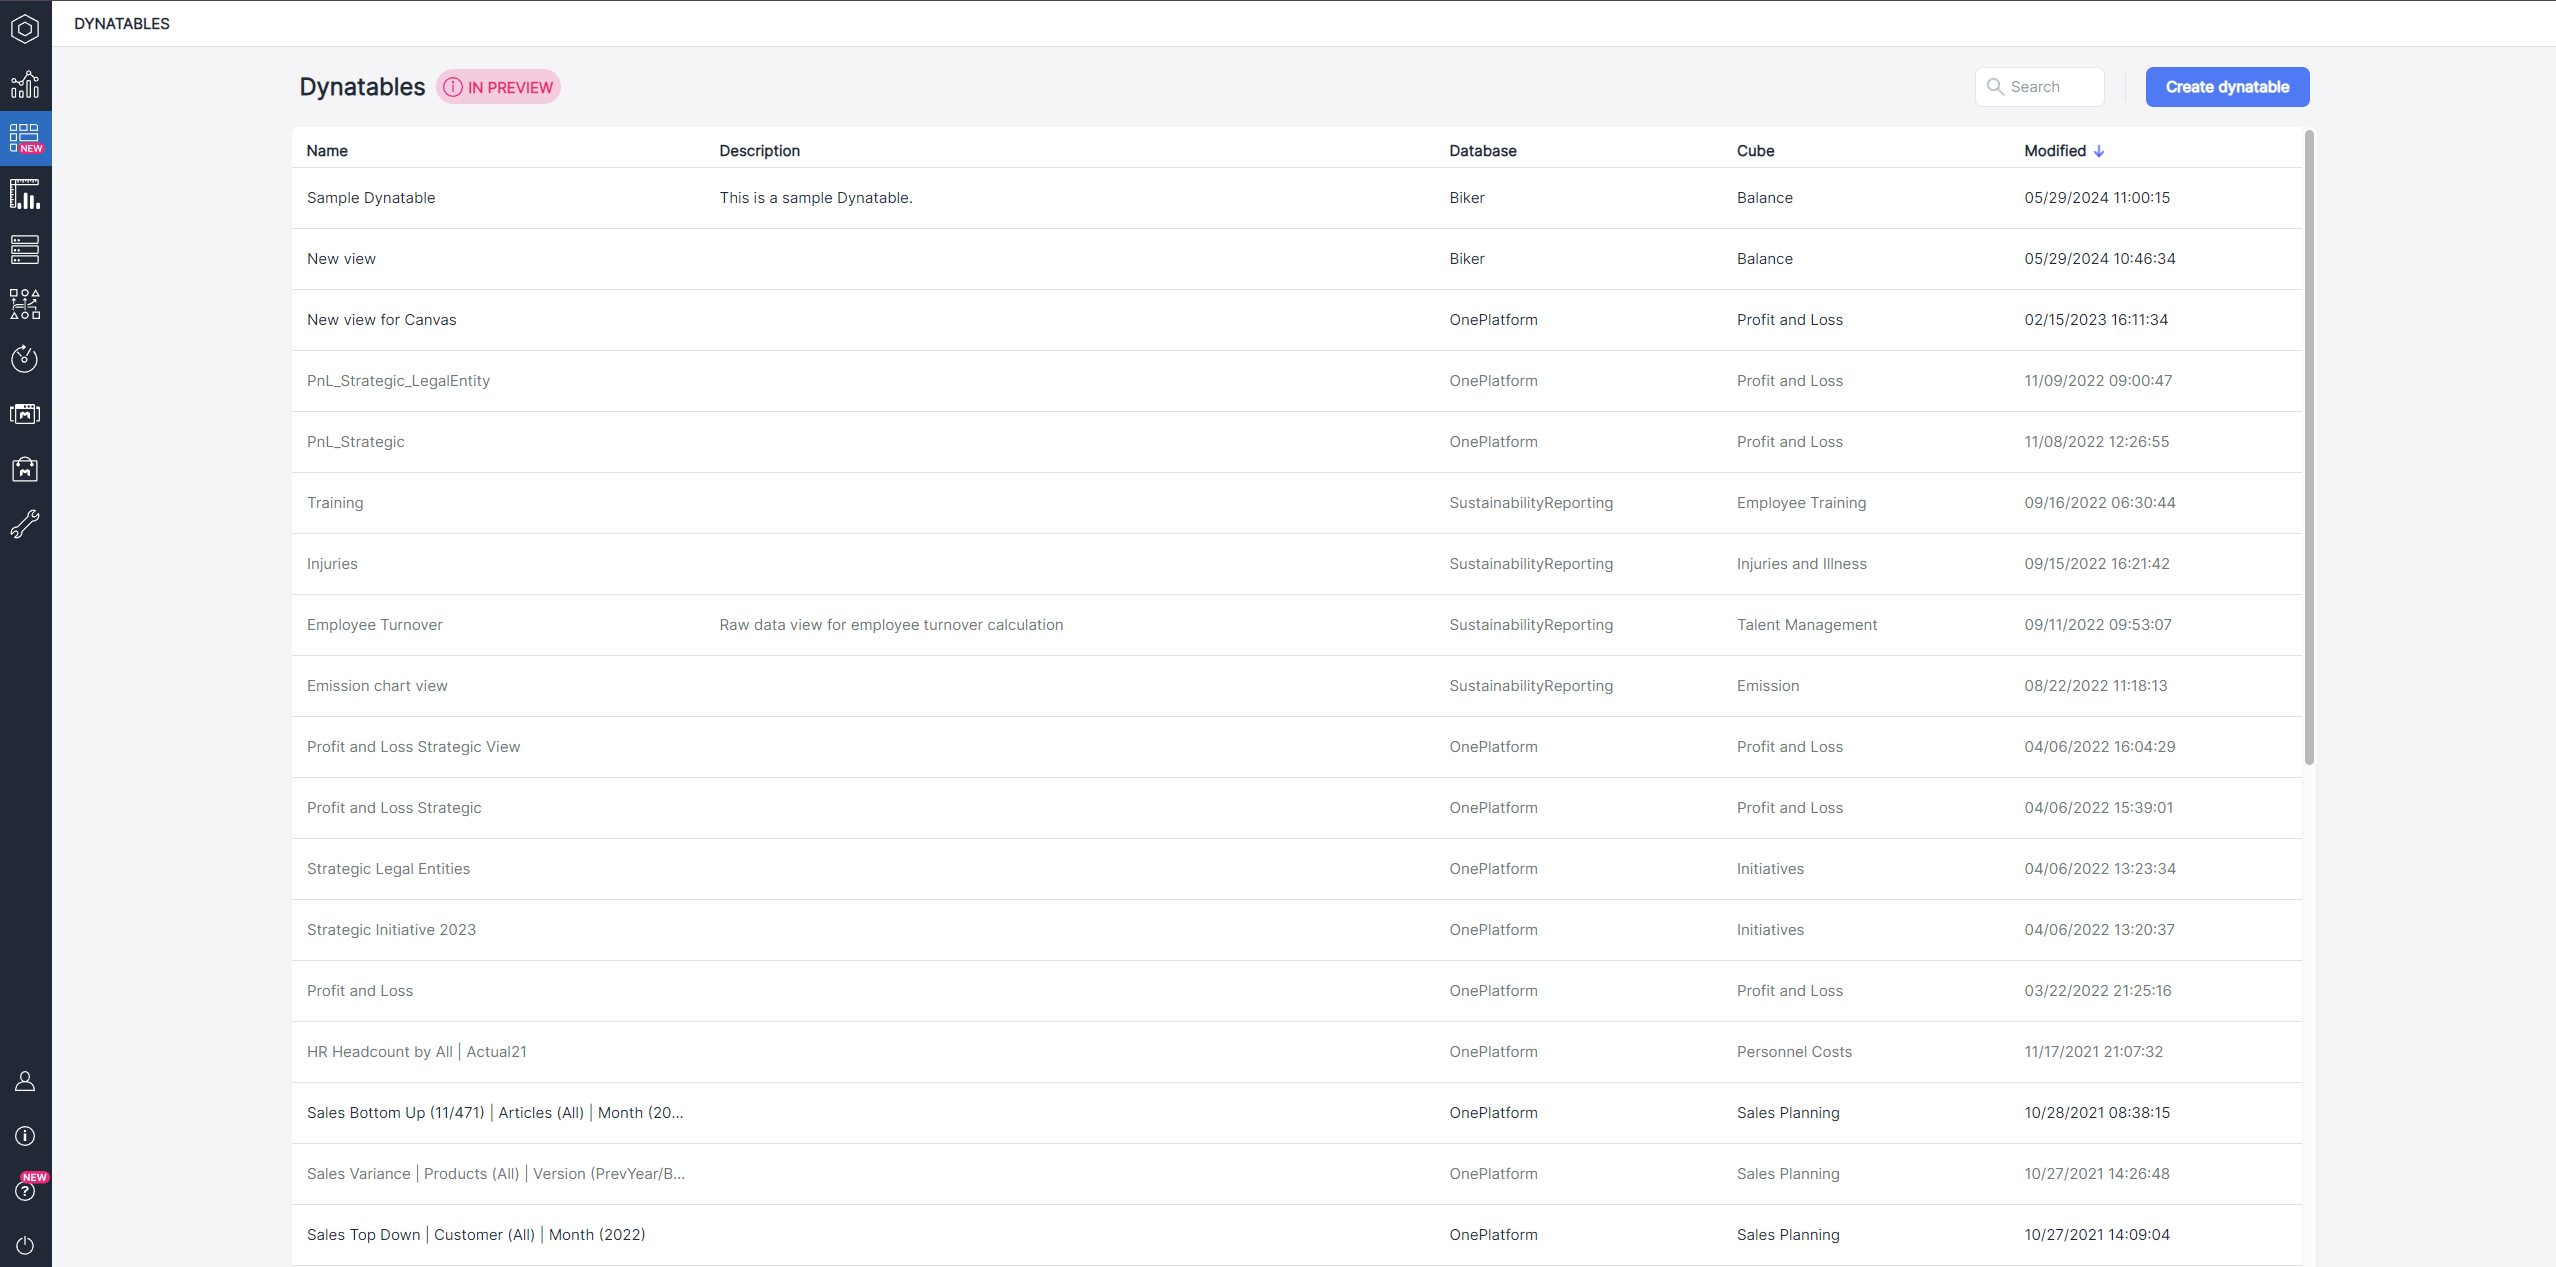
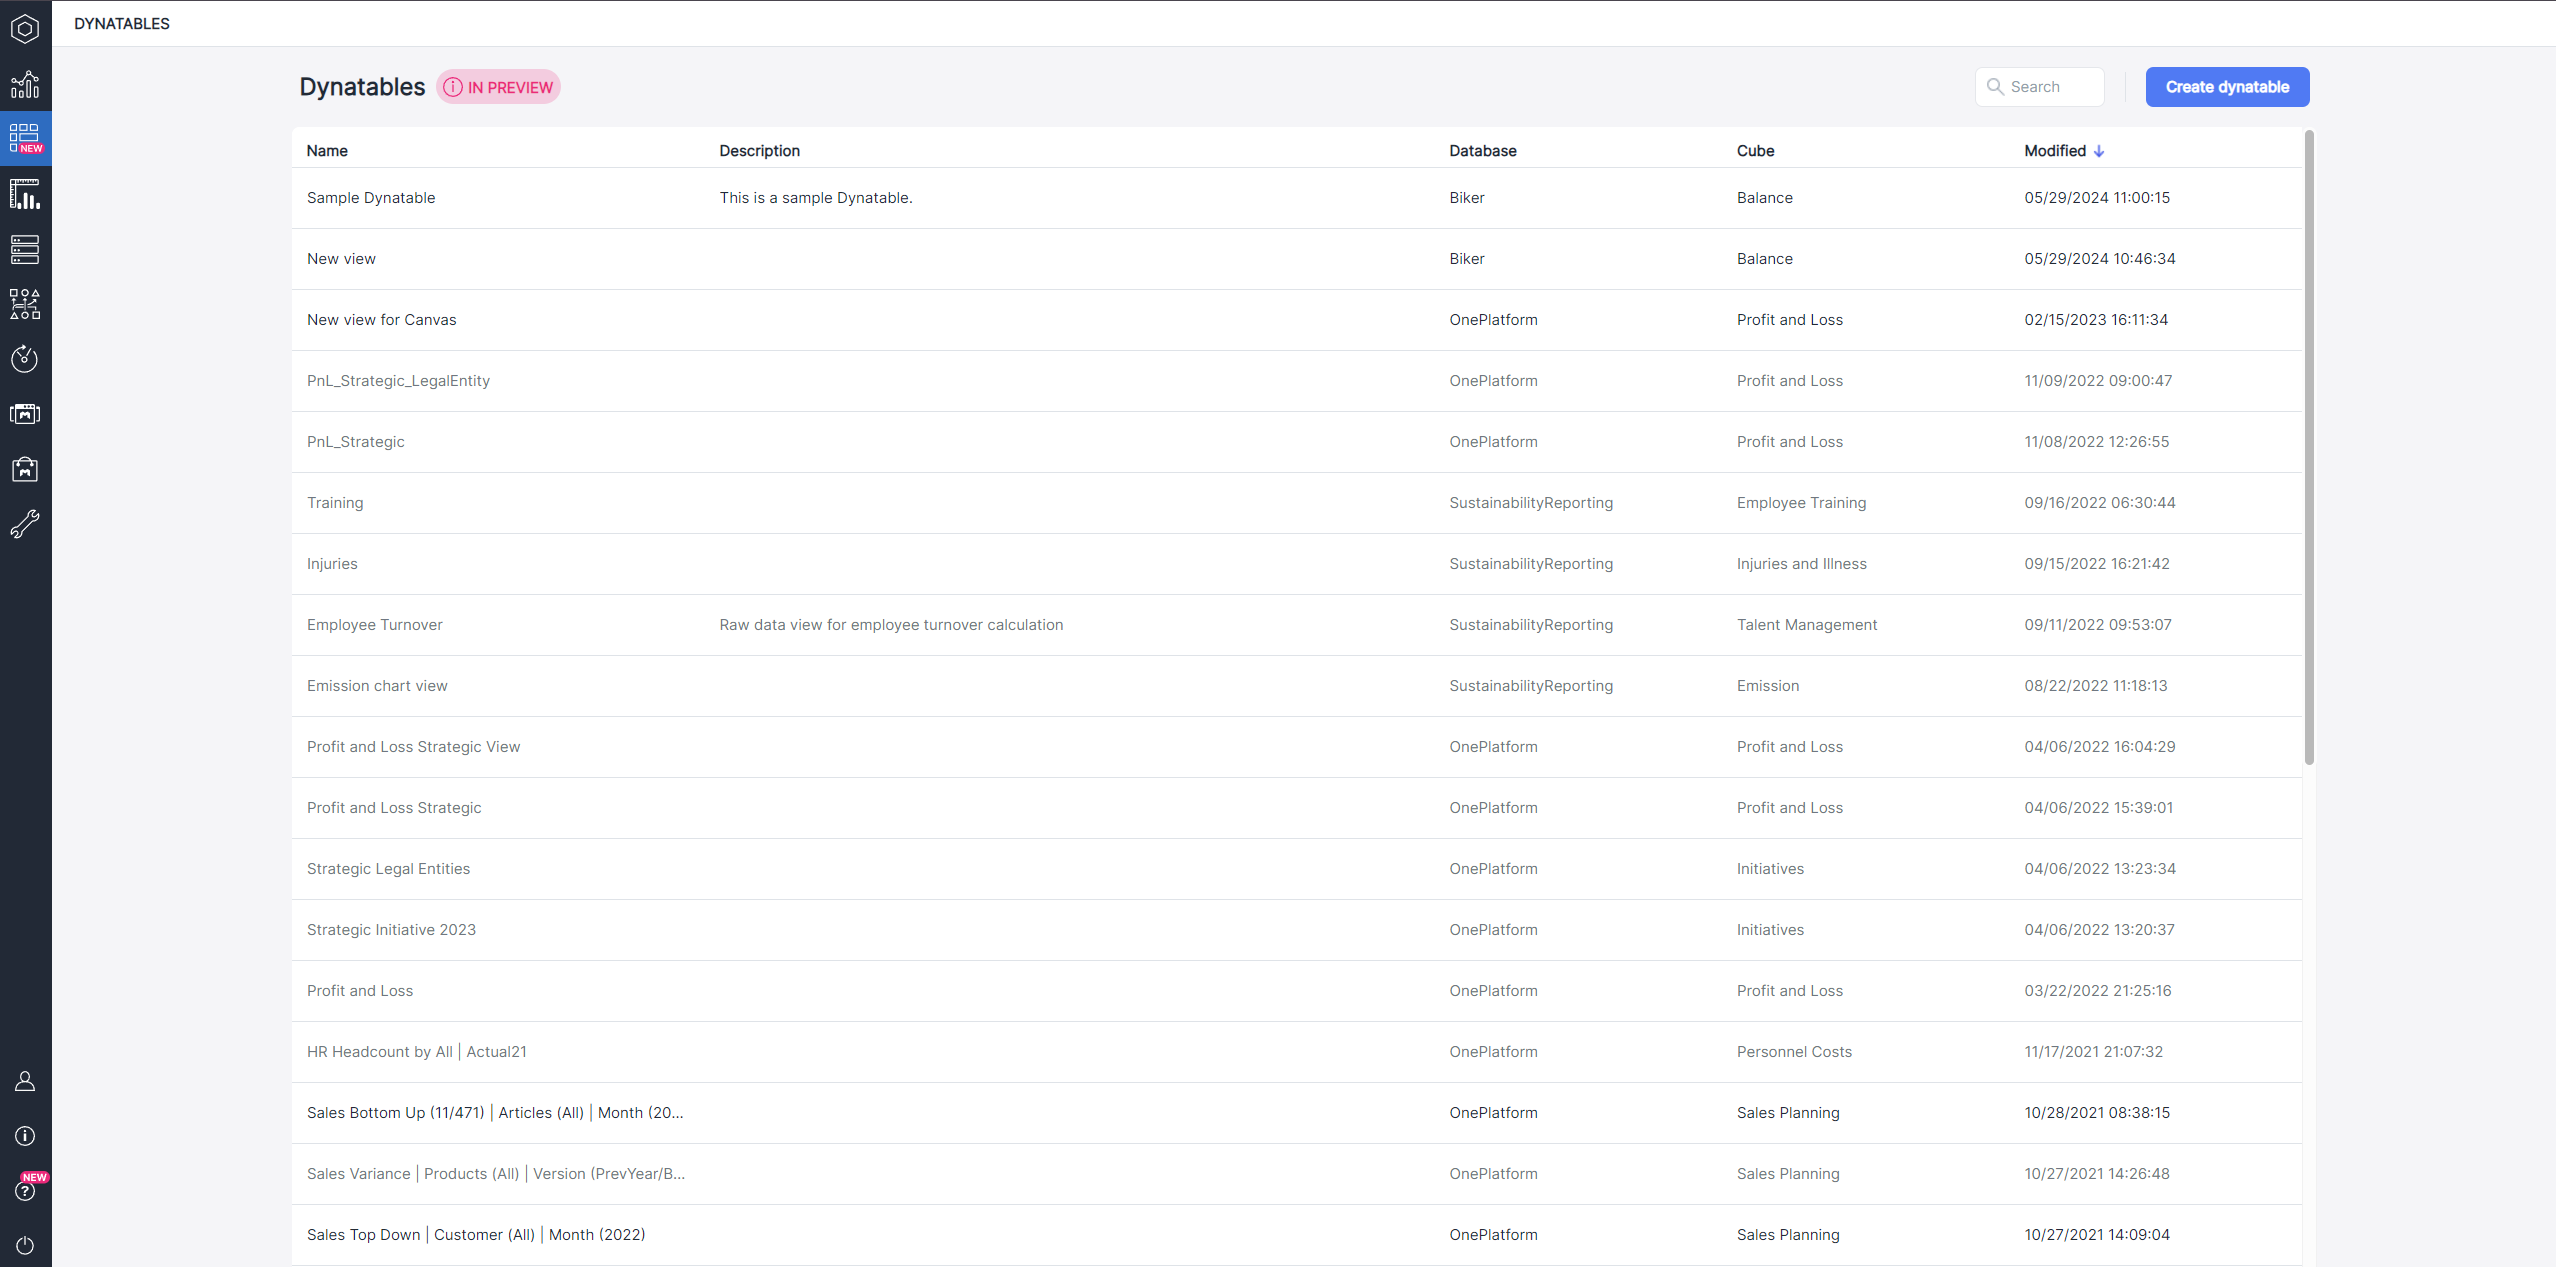
When you click on the Dynatables in the navigation bar, you will see a complete list of all the stored Dynatables. You can sort the Dynatables list in ascending or descending order based on the Name, Database, Cube, and Modified (default sort: descending) columns.You can use the search bar to find Dynatables by their name. You can open the Dynatable you wish to explore by clicking on it.
Keep in mind that Dynatables containing Lists or Virtual Dimensions may currently experience issues or disruptions. When hovering your mouse over these Dynatables, you will encounter a message preventing you from opening them. Access to these Dynatables will be made available in future releases.
Dynatable in Canvas
You can also use Dynatables within Canvas to create visually appealing and user-friendly reports that enhance data presentation and accessibility. For detailed guidance on how to get started, see the Adding Native Components to Canvas article.
Next step: Modifying Dynatables
Updated November 27, 2025


