Reports in Jedox Web are based on spreadsheets that are created, modified, and saved in the Designer component. These spreadsheets are then published in the Reports component for End Users, who use Reports to analyze data or enter planning figures.
In the Reports component, Reports will be presented in "User-Mode" for both Power Users and End Users. For more information, see Designer Mode and User Mode.
The Reports component has the following advantages:
- Database reports with DynaRanges are displayed in an activated state, meaning that the DynaRanges expand to show a row (or column) for each line of the DynaRange's subset result. If the dimension used as source for a DynaRange subset changes (for example, if new elements are added), the Report will automatically reflect this change.
- You can work with variables in Jedox Database Reports, dynamically creating different instances of the same Report.
- End users can enter data in unlocked cells, change ComboBox selections, and interact with the Report in various ways, but they cannot change the underlying design of the Report.
The actions that are available to a user in the Reports component depend on the rights given in the access rights object "ste_reports". For more information, see Rights Objects in Jedox.
The behavior of Jedox Views for users who do not have sufficient access to the original View content is described in Stored Views.
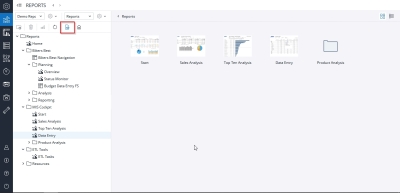
Reports can be displayed in two states: Design view and User preview. These views can be toggled with the "View" button, highlighted below:
Design view displays all of the files associated with the selected Report. It is also used to map variables. To see this feature in action, see Example: Report with Variables.
In User preview, the tile-based content window allows you to see and open Reports and navigate within the Report file system. For example, the report Overview in the folder group Reports > Bikers Best > Planning can be opened from the navigation panel as well as in the content area:
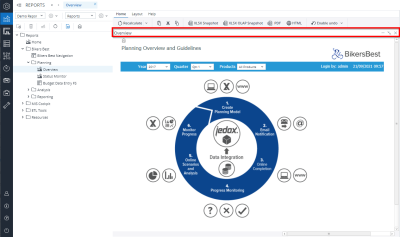
The report Overview has only one sheet. In this case, the sheet selector isn’t displayed in User preview mode:
Jedox Web administrators can optionally hide the title bar of the opened reports (red area in the left screenshot above) for all end users, allowing more screen space to be used for the actual report contents.
This can be done via the setting "Static Window Mode" (spreadsheet.static_window_mode) in the settings manager.
Note that when the Static Window mode is enabled, windows cannot be "arranged" in Reports. Non-maximized reports (popups) still work and show a title bar, allowing the user to move the report around. However, the report window only shows the "close" button, not the minimize and maximize buttons.
Administrators and application designers can create and change report groups and hierarchies, create hyperlinks to specific reports, and link to them from external applications, such as web pages or web portals.
Reports can be also shown in User Mode, which allows users to view and interact with Reports in limited ways. The mode shown to a user is controlled via the access rights object "ste_reports", defined for that user's role in the Administration component. For more information, see Rights with Impact on Jedox Web.
Jedox Design System for Reports
To help you design functional and attractive reports, we have developed the Jedox Models & Reports Design System. This system provides guidelines, reusable UI components, and other resources to assist you in creating models and reports in Jedox more efficiently and professionally.
Customizing tiles and organizing folders in Reports
You can customize reports with their own thumbnails in Jedox Web, thus facilitating the identification of files when navigating in user preview mode in Reports.
See how to do this in Custom Thumbnails in Reports.
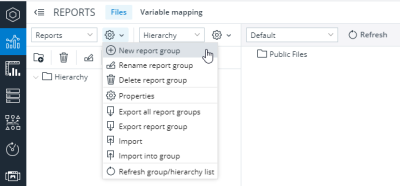
You can also create new Report Groups and new Report Hierarchies within the Design view.
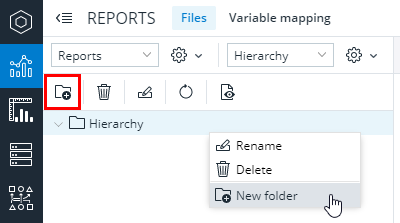
You can create a new folder with the folder icon or from the context menu:
You still need to create reports in Designer, which you can then drag as a so-called nodal point into a folder or report hierarchy.
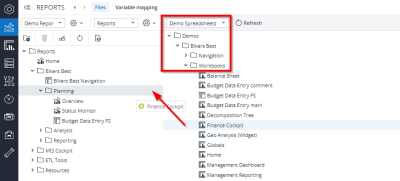
To do this for the workbook "Finance Cockpit", change to Design view, select the Files tab and then the folder Demo Spreadsheets/Demos/Bikers Best/Workbooks. Now you can drag the workbook "Finance Cockpit" to "Planning" in the hierarchy panel:
Result in user preview mode:
Updated April 9, 2024
