This article offers an example of how to create a report using variables.
- In Reports switch to Design view:

- Start by creating a new report group called Marketing:

- Next step is creating a new report hierarchy called Units:

- Create a new folder called Regions:

- Switch to the Variable mapping tab and select the type OLAP list:
The following dialog is displayed:

- Enter Europe as Fallback value; this value will be used if a mapping is not possible.
- Select Regions in the Demo database and click Apply mapping.
- Create the folder Years as a sub-folder of Regions.
- Set the variable mapping to OLAP list.
- From the List Selector, click on the Demo database and select Years.
- Enter All Years in the Fallback value field and click Apply mapping.
Important: Make sure you follow the naming conventions for folders.
Now switch to the Designer. Recreate the following Jedox View in a new workbook called Units Hardware:

For the following steps, we have to detach this View to replace the PALO.ENAME functions with the corresponding PALO.ESELECT functions. To detach a View, click the Detach button in the toolbar.
- In order to work with Regions and Years as variables, we will replace "=PALO.ESELECT(…)" in cell C6 with "=@Regions" and "=PALO.ESELECT(…)" in cell E6 with "=@Years":
Note: variables used in Jedox Views are always defined by =@[Name].
- Save and close this file.
- Switch back to the Reports module and click on the Files tab (Design view should be selected).
- Drag Units Hardware over to the Years folder in the Navigation pane and click on this report.
- For the Regions variable, double click on any of the fields in the Regions row to open the dropdown menus.
- Under List type, select Report list from the menu.
- Under the column List/dynamic folder, select Regions(/). Click Apply to confirm the changes.

- For the Years variable, double click on any of the fields in the Years row to open the dropdown menus.
- Under the column List type, select Report list from the menu.
- Under the column List/dynamic folder, select Years (/Regions). Click Apply to confirm the changes.
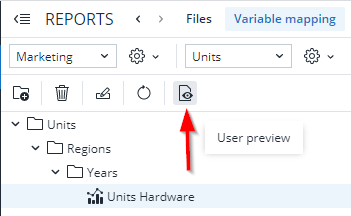
Once the variable settings have been accepted, the variables are entered by clicking on the User Preview icon in the Navigation pane, as indicated below:
Navigate to Regions > Europe > West > France > Years > 2014 in the Navigation pane and double click on the file Units Hardware. Your View should appear as follows:

Instead of an entire dimension (e.g. Regions above), you can also select a Jedox Subset list for variable mapping. Then the resulting dynamic folders are all displayed on the same level, not indented on the basis of their hierarchical levels.
If you select the list type OLAP list, then the variables come directly from the list (parent folders should have no mapping). In this case, it is possible to determine whether the variables in Reports are displayed or not. This display is typically not needed if the variables are mapped for batch printing purposes. By deactivating Expand, the variables are not displayed in Reports, but they are still available for batch processing. This gives you a better overview and saves a lot of computation time.
Updated June 12, 2026