To modify the presentation of your Dynatable, you can use the "Pivot" feature. You can drag and drop one or more dimensions into your Dynatable sections or interchange the dimensions displayed in the Point of View (POV), Rows, and Columns. You can also drag and drop dimensions from the Point of View (POV), Rows, and Columns sections to the Source area.
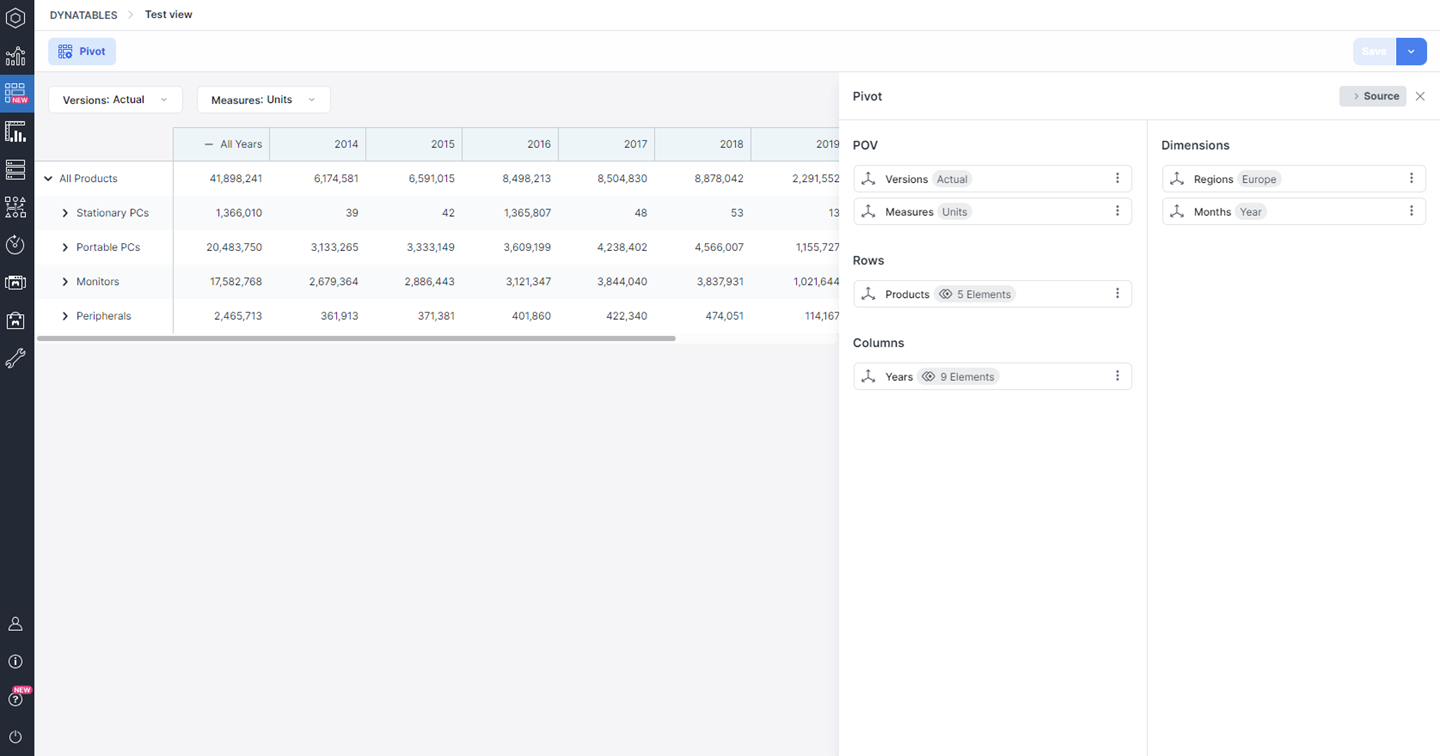
You can search for and select elements and aliases in the row and column dimensions. The selected elements are visualized as tags within the Pivot interface. You can expand or collapse the inner elements within any dimension in Rows and Columns, or perform Cross Drill Down on them. Additionally, you can choose an "Alias format" to customize how aliases are displayed.
Select Elements dialog
The Select elements (Dimension configuration) dialog allows you to define which dimension elements are included in a Dynatable and how they are displayed.
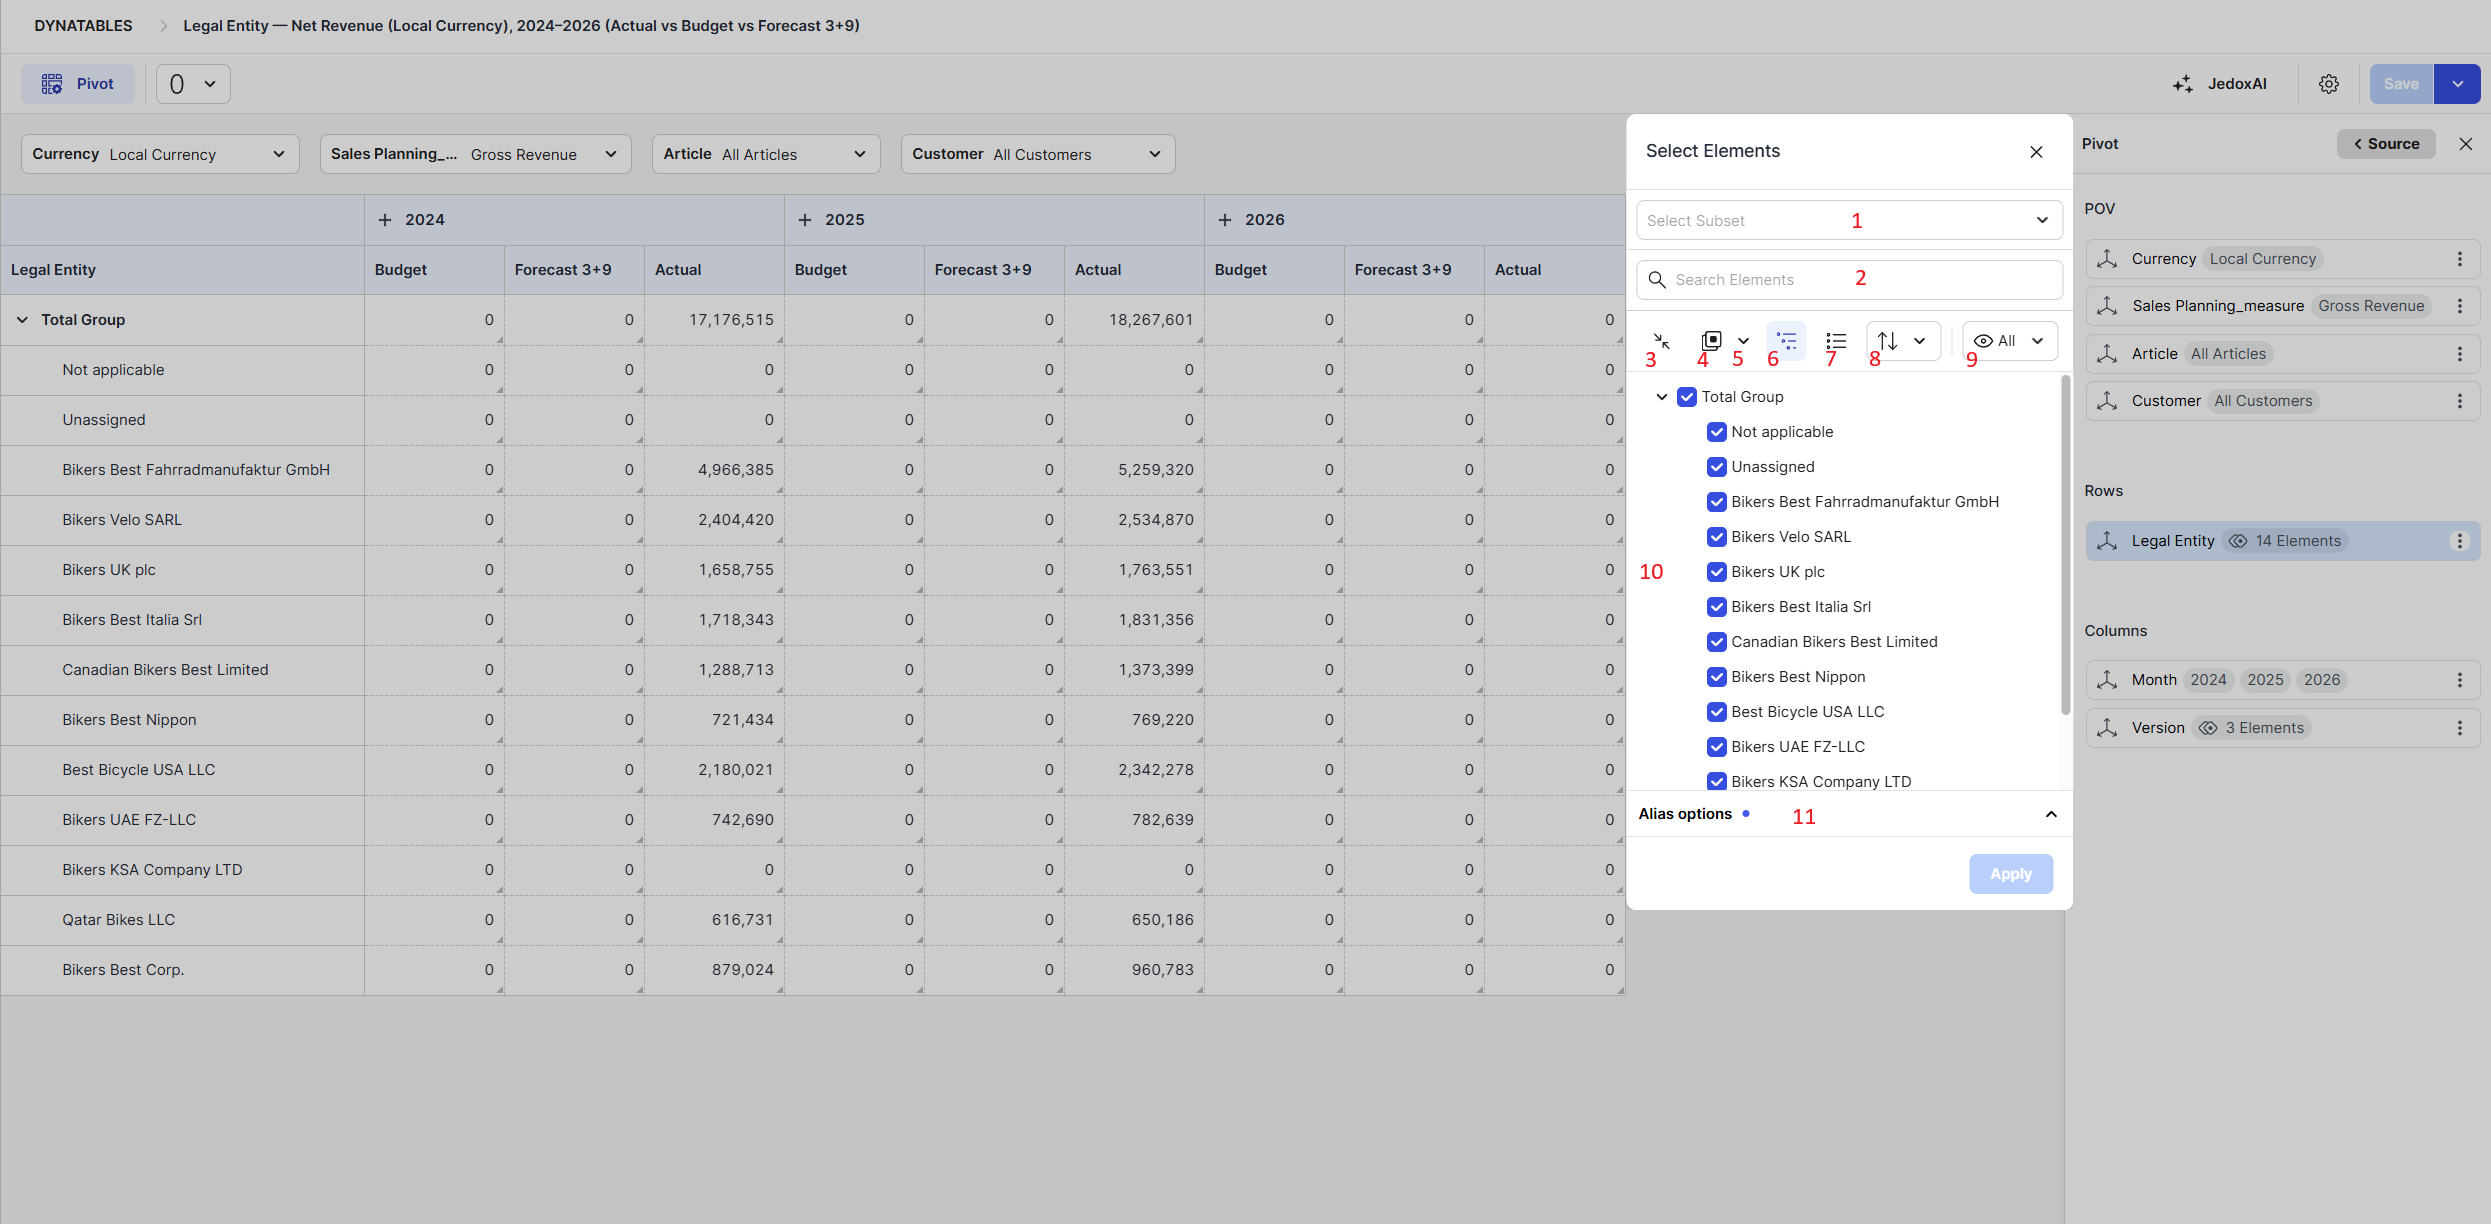
At the top, the Select Subset (1) enables you to select the already existing Subsets. The search field (2) allows you to quickly locate specific elements within large hierarchies. As you type, the list dynamically filters to show matching elements, making it easier to navigate complex structures without manually expanding multiple branches. Directly below, the toolbar provides a series of controls for managing the element view and selection behavior.
-
The Expand All / Collapse All control (3) lets you open or close the entire hierarchy with a single click. This is particularly useful when working with deep or complex trees, as it removes the need to manually expand or collapse each level one by one.
-
The Select all/ Deselect all option (4) enable quick bulk actions for managing element selection. With a single click, you can select all elements or deselect all currently selected items, which significantly speeds up workflows when dealing with large datasets.
-
The Shortcuts split button (5) provides advanced selection options for more precise control. From the dropdown, you can select an entire branch (all children of a selected parent), select elements by hierarchy level across all branches, or select all base-level elements regardless of their position in the hierarchy.
-
The Flat list/ Hierarchy toggle (6and 7) allows you to switch between a hierarchical and a flat view of the elements. In Flatten mode, all elements are displayed in a simple list without indentation, while Hierarchy restores the original hierarchical structure, making it easier to understand relationships between elements.
-
The Sorting option (8) lets you organize elements according to your needs. You can keep the default structure order, sort elements alphabetically in ascending or descending order, or apply a custom-defined sorting to better align with specific reporting or analysis requirements.
-
The Display mode toggle (9) controls how elements are shown in the window. In “All” mode, the full hierarchy is displayed and all toolbar actions are available. In “Selected” mode, only the chosen elements are shown, allowing users to focus on their selection while limiting available actions to those relevant for refinement. In “Selected” mode, you will only see the Expand/collapse, Hierarchy, Flat list, and Sorting options.
The element tree area (10) displays the hierarchy of elements with checkboxes for selection. You can expand or collapse individual nodes and select or deselect elements at any level. Selecting a parent automatically affects its children unless individual elements are manually adjusted.
The Alias options (11) at the bottom provides options to select between the available aliases (if any) and choose a format of showing that alias in the Dynatable. The available formats are: Alias, Element name, Element name - alias, Alias - element name, Element name (alias), Alias (element name), Element name alias, and Alias element name.
Finally, the Apply button confirms the selection and applies the chosen elements and settings to the Dynatables configuration. Changes made in the window are only reflected after clicking this button.
Element selection and aggregation in POV and Source dimensions
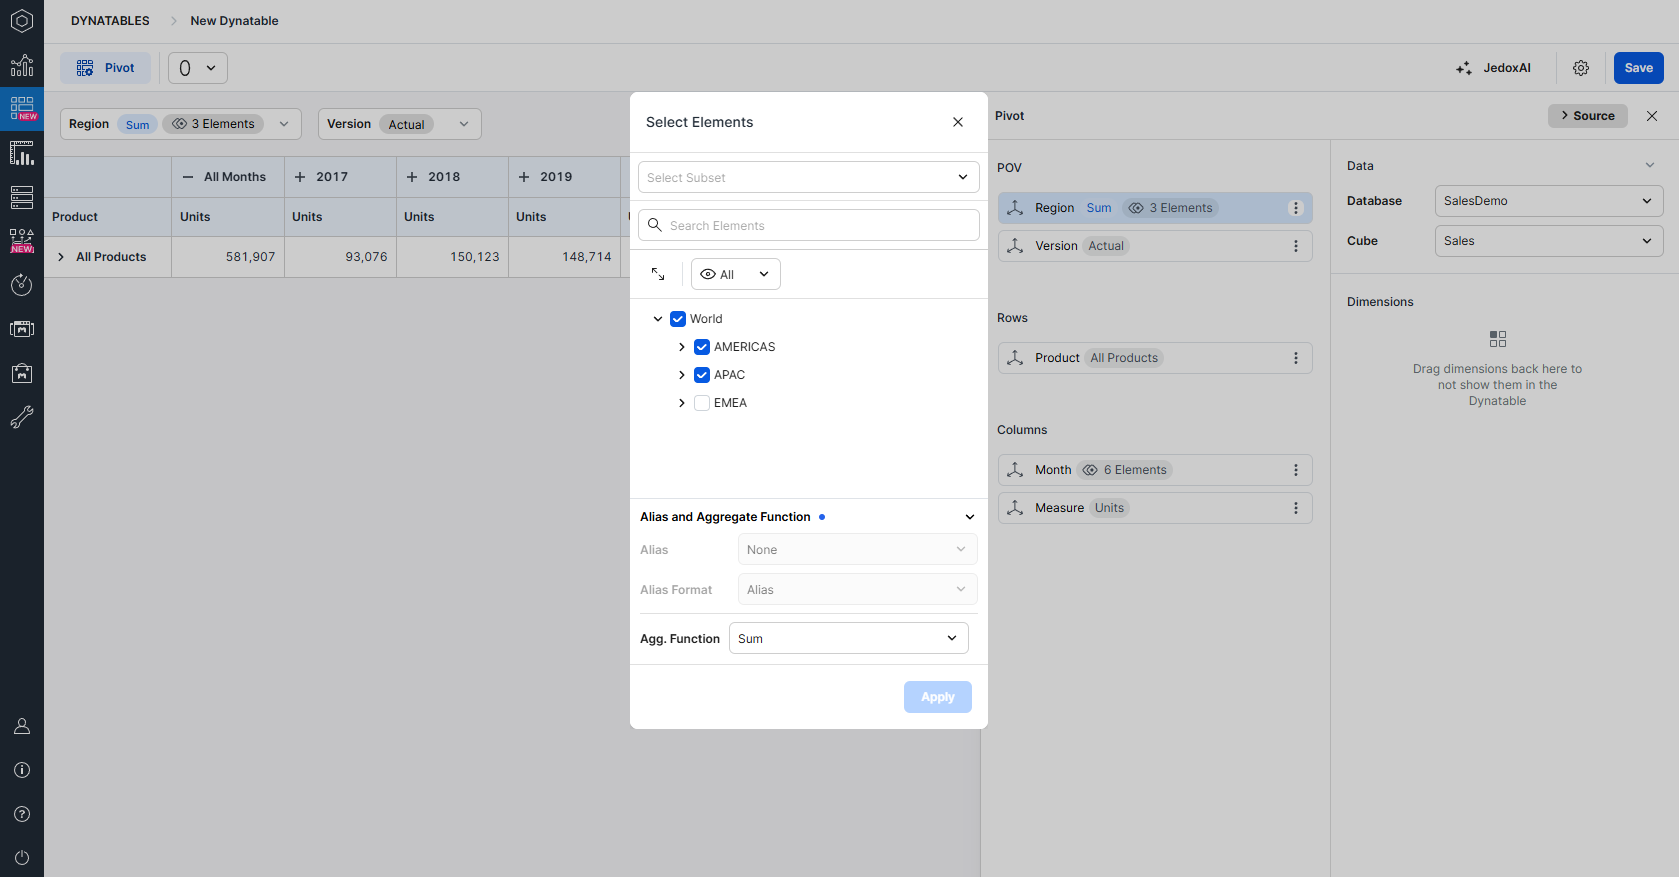
For dimensions in the Source area or the POV section, it is possible to select multiple elements and aggregate them. This allows you to control which data is displayed more precisely, and to show the aggregation result of multiple elements directly within the Dynatable.You can select multiple elements either through the Select Elements dialog or directly via the POV combobox.
Element selection and aggregation in POV dimensions
 n
n
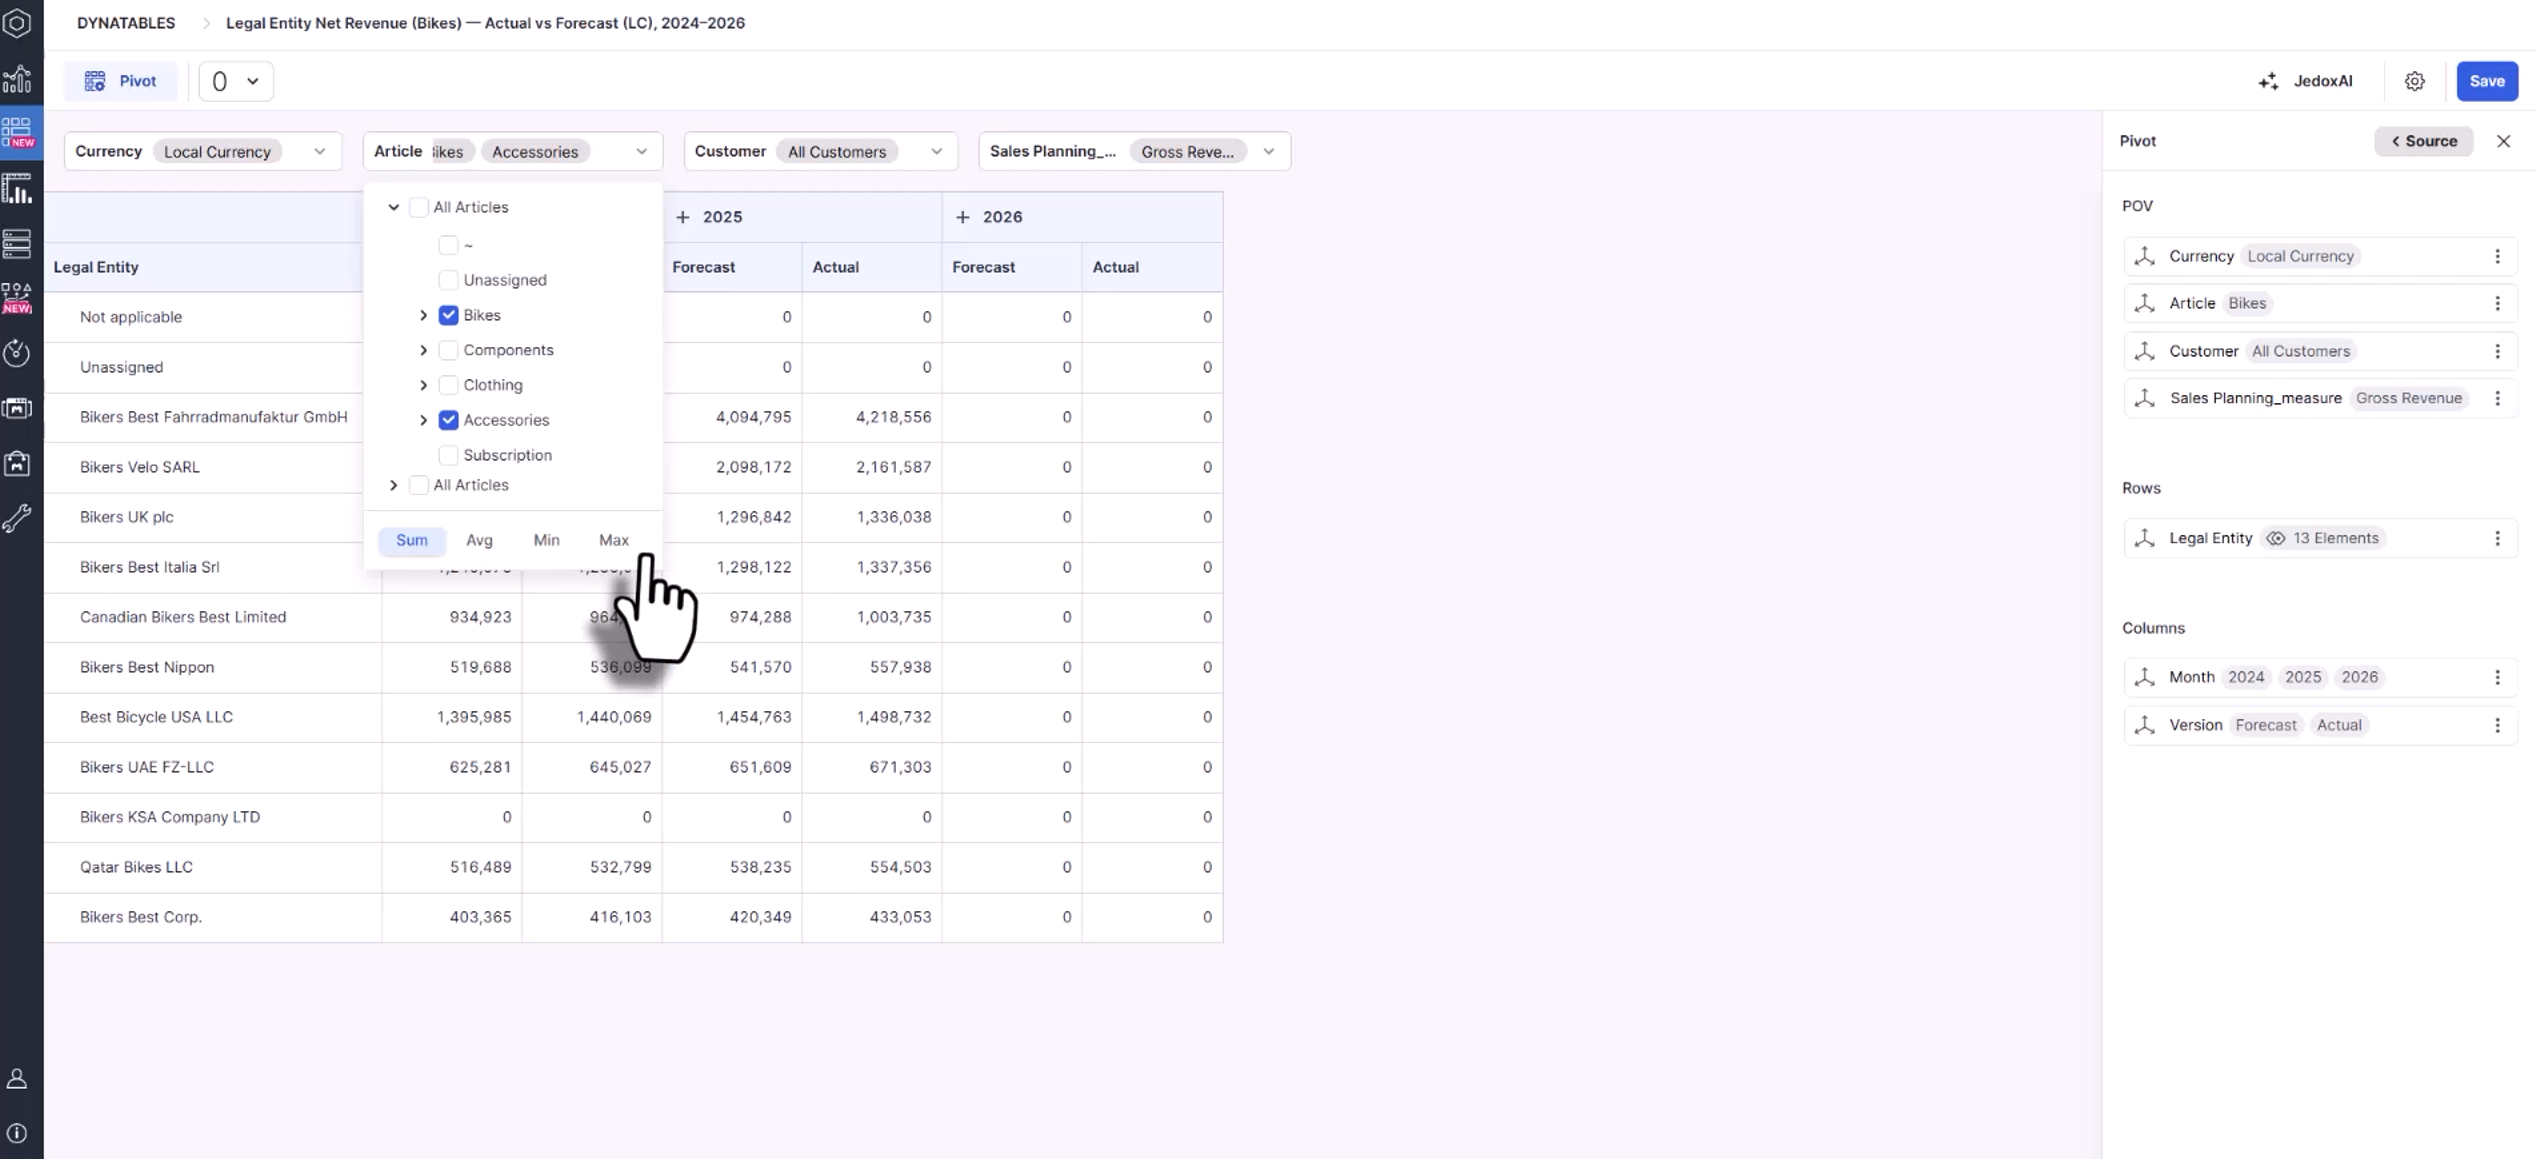
Multi-selection is performed by activating the checkboxes of the desired elements. Once multiple elements are selected, through the “Alias and Aggregation Function” section of the Select Elements dialog, you can apply an aggregation function to the selection. The available aggregation functions are Sum (default), Average, Minimum, and Maximum. After confirmation, the selected aggregation and the number of selected elements are displayed as tags for the dimension in the POV area, and the Dynatable is refreshed accordingly.
Element selection and aggregation in POV comboboxes
The same functionality is available in POV comboboxes. You can select one or more elements directly within the combobox, and when multiple elements are selected, aggregation options (Sum, Average, Minimum, Maximum) appear in the combobox footer. The chosen aggregation and the number of selected elements are then displayed as tags in the combobox, providing a clear indication of the active selection.
Note that multi-selection is enabled when both cross drill-down and Write-back are disabled in the Dynatable settings. This is the default configuration for newly created Dynatables.
Also, note that while selections support aliases, alias formats, subsets, and consolidated elements, when subsets are used, selection is limited to a single element.
Sorting table content in Dynatables
Dynatables provide flexible sorting options to help you organize and analyze data directly within the table.
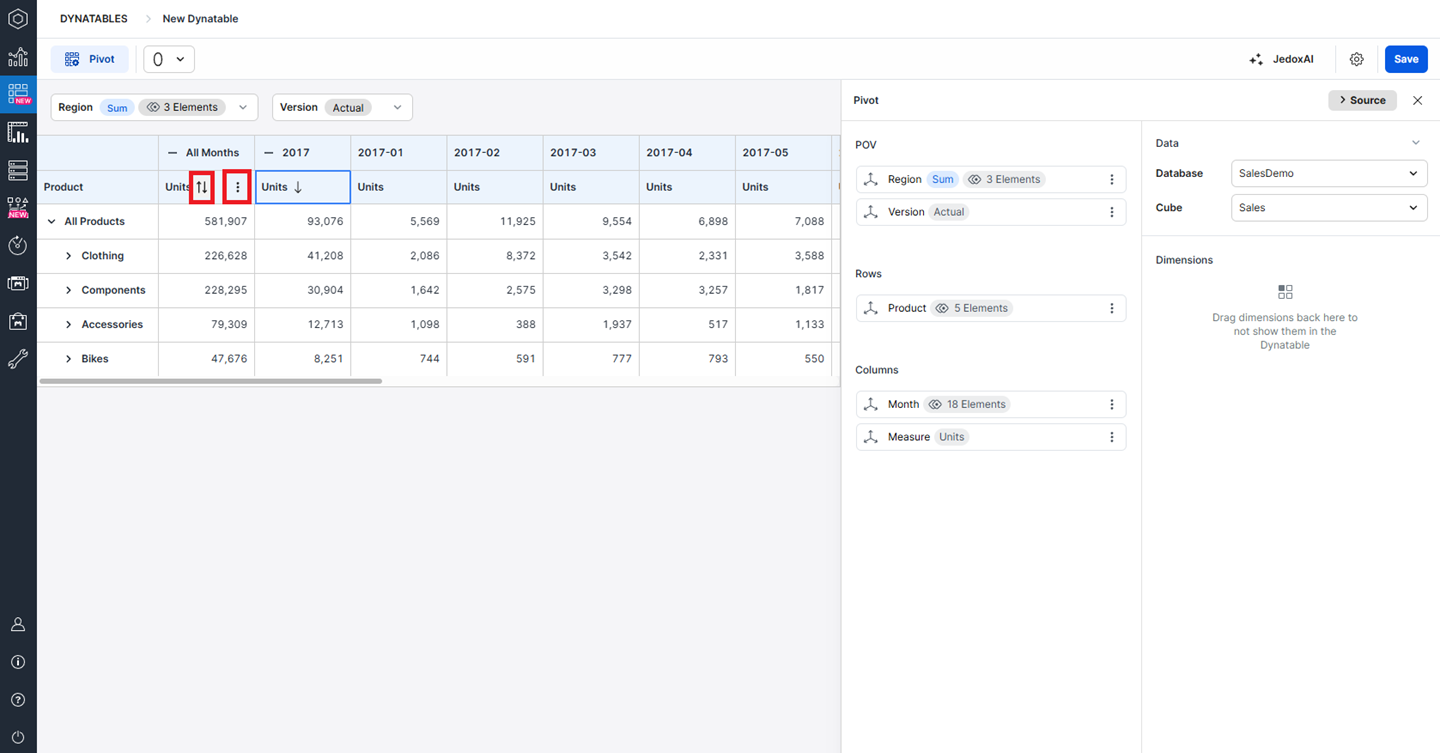
Sorting can be applied to both row header columns and data columns, depending on how you want to organize the table. Row header columns can be sorted alphabetically in ascending (A→Z) or descending (Z→A) order while preserving the hierarchy structure. This ensures that parent-child relationships remain intact even when the order changes.

Data columns, in contrast, can be sorted based on their numerical values. This allows you to reorder rows according to the values in a selected column, making it easy to identify highest or lowest values and compare results across elements.
Sorting can be triggered directly from the column header or through the column menu. The current sorting state is indicated in the column header by an up or down arrow, providing clear visual feedback.
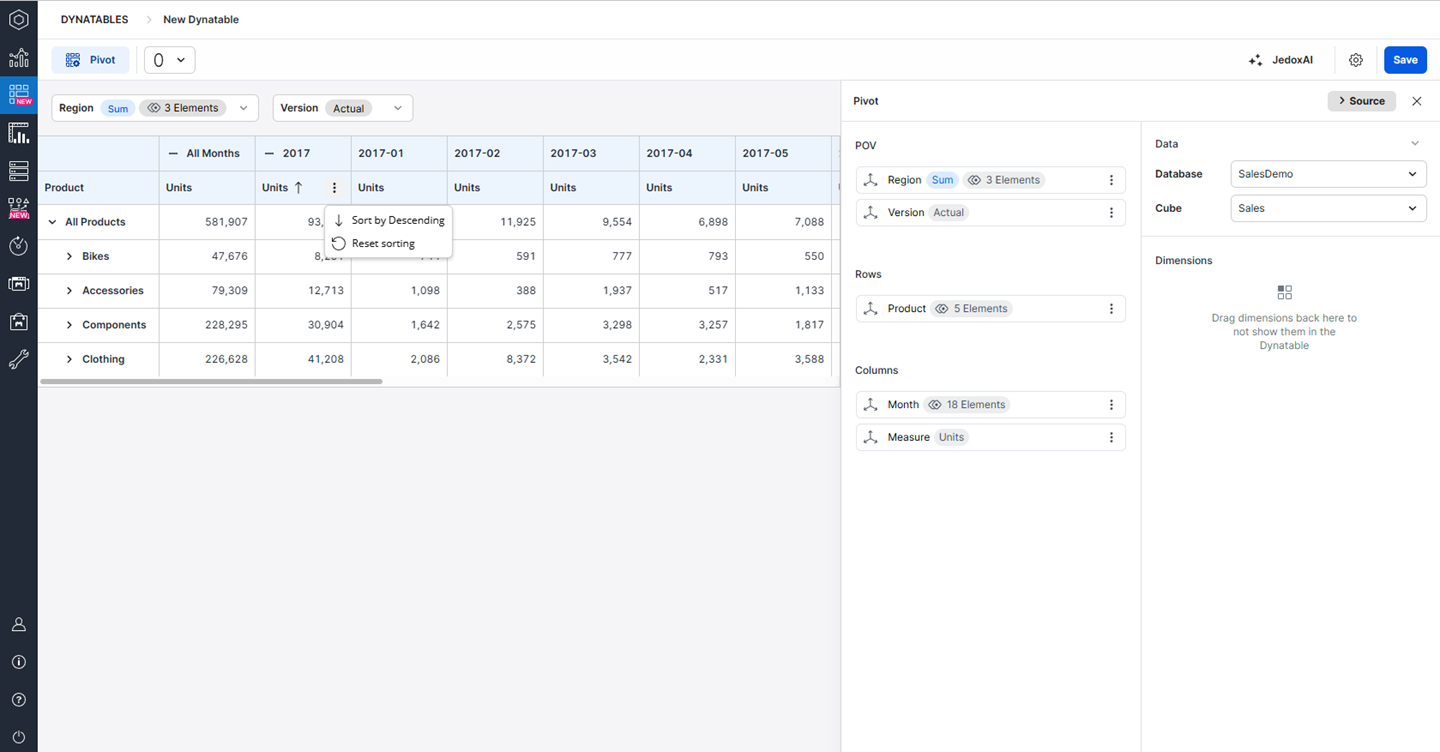
In the column menu, you can switch between Ascending, Descending, and Reset sorting. Selecting Reset sorting removes any applied sorting and restores the original order of the data.
Stored Subsets as a source
You can also use a stored subset as a source for a dimension. This makes it easy to apply both simple and complex element selections based on existing subset filters—such as Data, Attribute, or Picklist. By using stored subsets, you can quickly access relevant element groups without having to recreate filters manually each time.
You can also refine the selection further by choosing only specific elements for the dimension that sources its elements from a stored subset. This helps ensure that only the elements most relevant to your analysis are displayed.
Note that stored subsets that rely on parameters (such as cell references, named ranges, or @variables) are not supported.
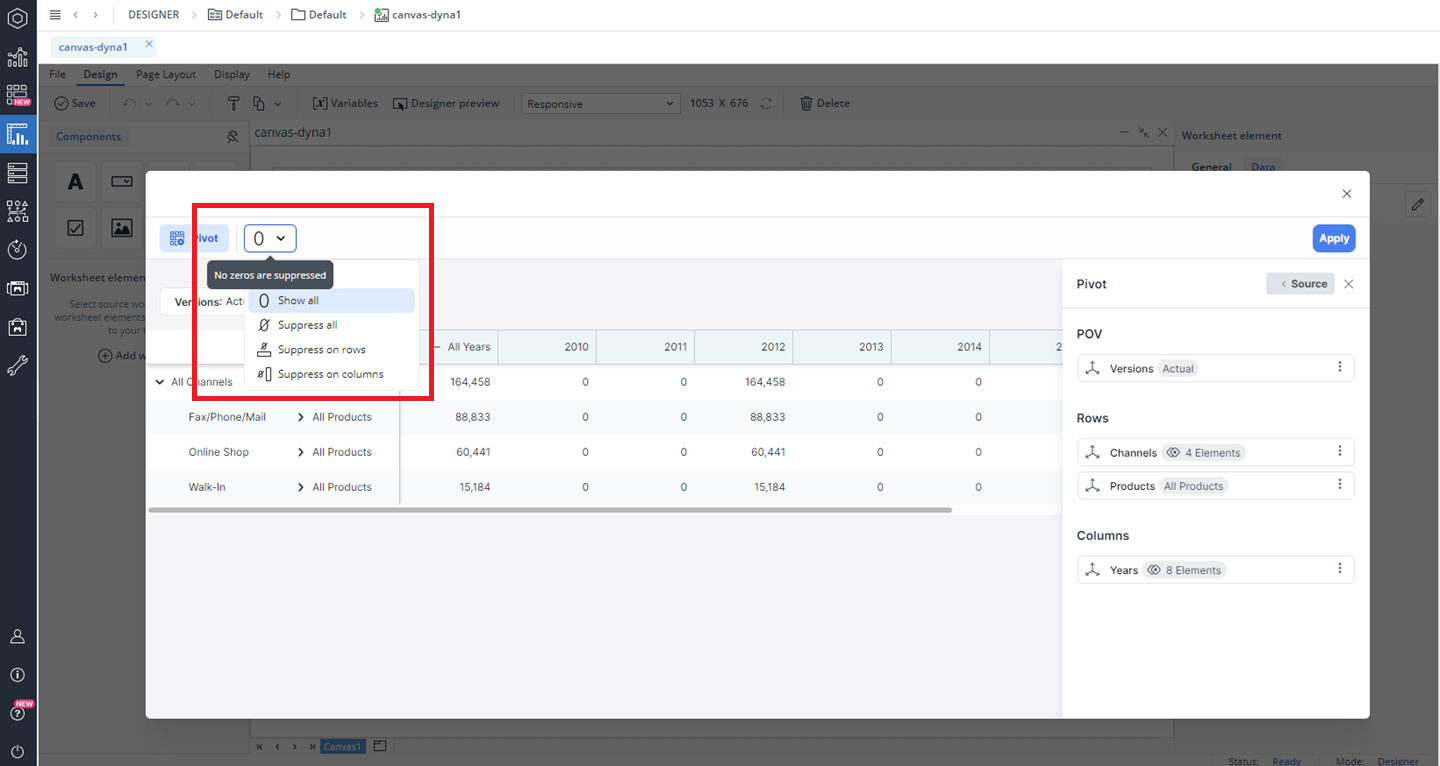
Zero suppression
Zero Suppression in Jedox is a feature that enhances data visualization and reporting by hiding rows, columns, or data points with zero values. This functionality helps improve readability and focus by displaying only relevant, non-zero data, eliminating unnecessary clutter in your charts, tables, or reports. By using Zero Suppression, you can create cleaner and more efficient reports that highlight meaningful insights.
You can enable Zero suppression through the button on the main Dynatables UI.
Data Entry in Dynatables
Dynatables support data entry functionality, allowing users to input and update values directly within tables. To be able to use this feature, administrators must first configure Global Dynatables to be either write-back enabled or disabled. Only Dynatables with write-back enabled will display editable data entry cells, allowing users to modify values. All other Dynatables will function normally, without data entry capabilities or visual indicators for editable cells. Users with appropriate permissions can enter data directly into single cells, with changes instantly written back to the OLAP database.
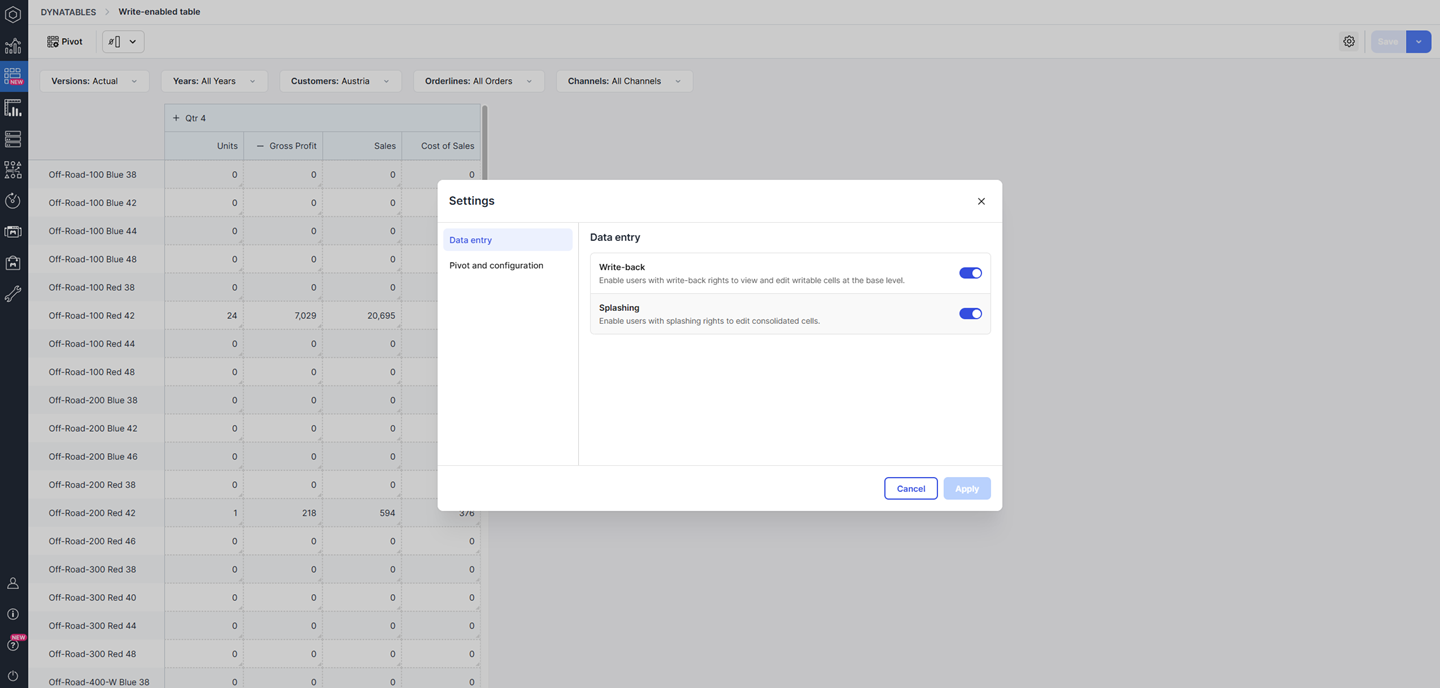
Enabling and managing Data Entry
The ability to enter data directly into cells is governed by user permissions and settings. A Settings button, located next to Save in the Dynatable UI, provides users with access to Data Entry configuration options. This interface is designed to ensure controlled access as follows:
-
Users with full access or D rights (
sub-set viewandste_filesright objects): Can modify the Write-back and Splashing settings, allowing them to actively interact with data and adjust configurations as needed. -
Users with limited access rights to either of these right objects can only view the modal in read-only mode, where all toggles are disabled. They can close the modal using the X button. This allows them to see the settings without being able to change them. (For more information on Dynatables rights, see sub-set view, ste_views, and ste_files sections of Rights Objects in Jedox)
Only Global Dynatables with Data Entry enabled will display editable cells. All other Global Dynatables will continue to function normally without data entry indicators or write-back capabilities.
When the user lacks sufficient rights to access the View or Dynatable, or when a stored View or Dynatable has an empty dimension, an error message will inform users of the issue.
Entering data
Once Dynatables write-back is enabled, users with write access can easily identify editable cells, which appear highlighted to indicate that data entry is allowed. Note that this functionality is determined by user permissions and cell properties retrieved from the OLAP database.
If you have the adequate access, you can enter data directly into a single cell. After pressing Enter or clicking outside the cell, the value is immediately saved to the OLAP database. The updated cell, along with any consolidated cells affected by the change, is highlighted in blue to indicate the update. Dynatables refresh automatically after data entry, so no separate save or submit action is required.
You can also input splashing parameters directly into cells using any available splashing commands. The entered values are processed and written back accurately based on the specified splashing command, ensuring precise data distribution.
Watch the video below for a practical example:
Type-Specific Data Entry and Error Handling
Dynatables support type-specific data entry, ensuring that values are entered according to the designated cell type (for example, numeric or string). For numeric fields, Dynatables preserve the existing number format. For instance, if the table uses a 1.2 format, newly entered numbers will automatically follow the same format.
If there is an error, for example, when an invalid value is entered or the user has insufficient rights, Dynatables display a targeted error message that describes the issue and provides guidance on how to correct it.
String Editor/Reader
The String Editor provides a robust solution for editing text within Dynatables. Users with write permissions can select a string-type cell to open a text editor, allowing text input and scrolling. If single-cell data entry is enabled, the input is written directly to the cube. The String Editor also supports keyboard navigation, enhancing accessibility and ensuring a smooth text-editing experience.
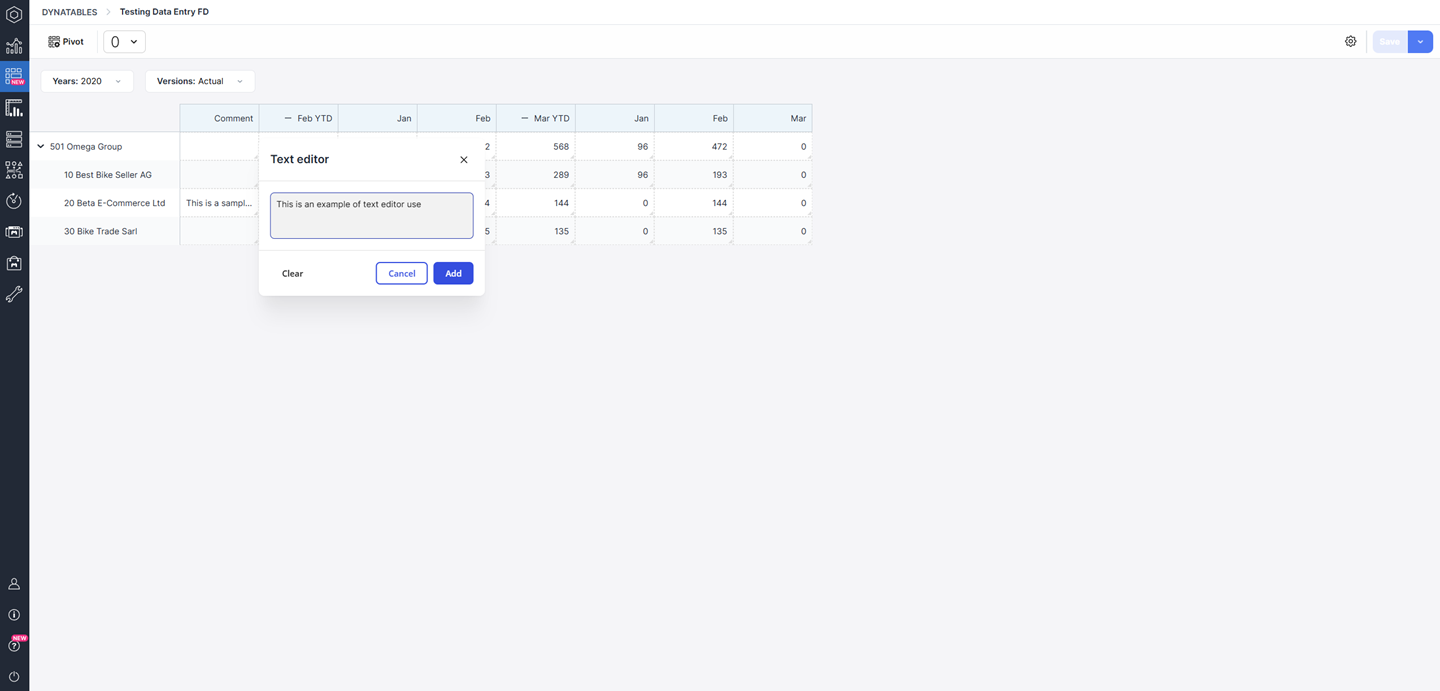
The ability to open the String Editor directly using keyboard shortcuts ensures a quicker and more efficient workflow. This feature allows users to read and edit textual data without relying on a mouse, significantly enhancing productivity and accessibility.
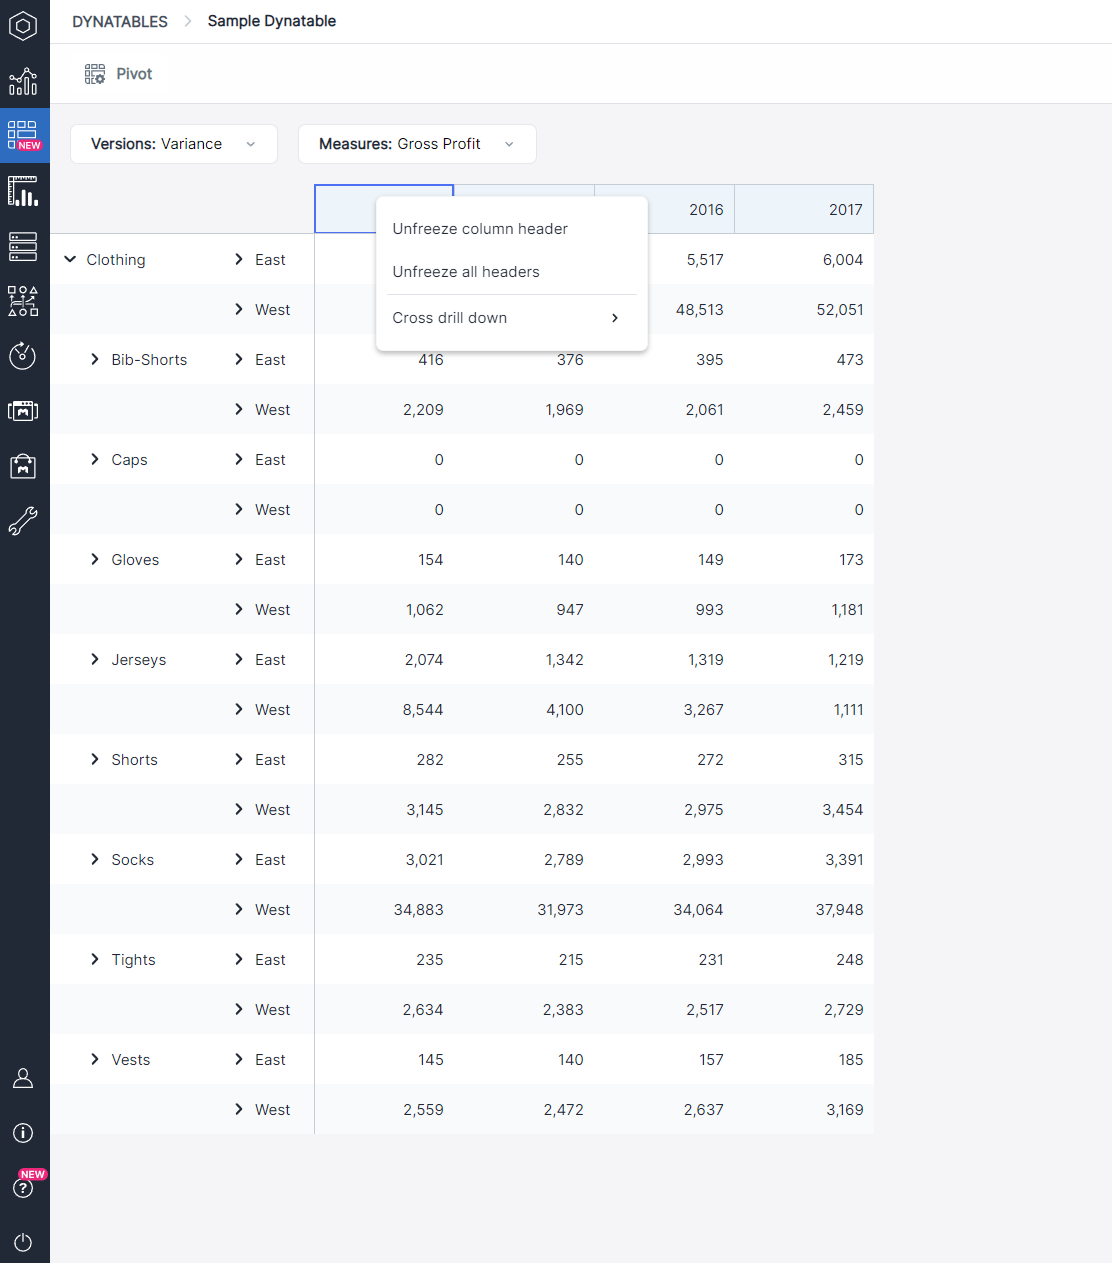
Unfreezing header and rows
By default, the column and row headers are frozen, ensuring they remain visible at all times as the user navigates through the Dynatable. The fixed headers provide a consistent reference point, enhancing the overall usability and efficiency of the Dynatable. To unfreeze the header and rows, simply right-click on them and select "Unfreeze column header."
Saving Dynatables
After customizing a Dynatable to suit your preferences, you can save it for future use. When saving, a confirmation prompt will appear to ensure your action is intentional. Additionally, if you need a similar Dynatable with minor adjustments, you can use the "Save As" feature to create a duplicate and save it under a unique name or ID.
Note that Dynatables can be saved according to the user's Role Rights, which are categorized as follows: D (Full Rights), granting the ability to create both Global and Private Dynatables; W (Write), enabling the saving of Private Dynatables; R (Read), allowing users to only view Dynatables; and N (None), providing no access to the Dynatables.
Updated June 1, 2026