This document previews the features and changes included in the upcoming Jedox Platform release. Deployment to test environments is scheduled for the second half of May, with production rollout to follow. See Jedox Version Auto-Update for details on the release process.
Web
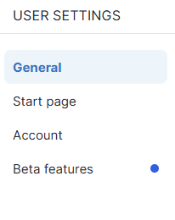
New dialog to enable beta features
The User Settings dialog now has a setting to enable and disable beta features, including the new Integrator UI and newly designed side navigation bar. Changes appear immediately after clicking OK.

A small badge appears in the sidebar and User Settings dialog when new beta features are available:
New navigation sidebar
The Jedox Web sidebar has been redesigned with a more modern, intuitive layout and improved visual clarity. Less frequently used actions have been moved to the Administration area. This feature is in beta release and can be enabled in User Settings.

Enhanced report viewing experience
We have made several updates to simplify headers in Jedox Web reports. By improving the screen space and reducing clutter, we have enhanced the usability of reports for both end users and report builders.
-
Removed title bar: the report title bar has been removed from the main viewing area, providing users with additional screen space for a more efficient report experience.
Note that the title bars are removed for reports in the Report section and will still be visible in the Designer component and in dialogs, such as those within the model’s dialog. When using a “Report Hyperlink,” for example, in an external application, the title bar is removed only from newly generated hyperlinks; report hyperlinks created with the title bar enabled in a previous version will still display the title bar. -
Simplified report properties: the "Show title" option in the Link tab of the report properties menu has been removed, as it is no longer necessary.
-
Administration updates:"Static window mode" has been removed from Spreadsheet settings in the administration component, as it is no longer necessary.
Note that if a report link was previously generated with the “Show title” option enabled, this behavior is preserved. Existing links remain unchanged to ensure backward compatibility.
Support for Polish language
Jedox Web now speaks Polish! You can change the language in Jedox Web user settings. See Languages for details.
Canvas
Freeze pane
The Freeze pane feature is now generally available. Canvas authors can now access the "Freeze pane" feature in Canvas Inspector without setting a feature flag. This allows for easier access to the feature, eliminating the need for custom configuration.
-
Freeze pane location: when opening a Canvas report in Designer and selecting a "WSS Frame" object, the Inspector on the right side displays the options for the Freeze Pane feature.
- Freeze pane options: when you activate the Freeze pane option in the inspector, you can set properties such as maximum width, maximum height, and select the number of rows and columns to freeze.
-
Maximum width and height limits: the maximum width is 1600 pixels and the maximum height is 1200 pixels.
-
Frozen rows: users can freeze one or more rows at the top; these rows remain visible while scrolling vertically.
-
Frozen columns: users can freeze one or more columns on the left side; these columns remain visible while scrolling horizontally.
-
Consistency in freeze pane settings across versions: if you previously enabled the Freeze pane option (or set the feature flag to true) in Jedox 2025, your settings will be automatically carried over when you open reports in Jedox 2026.
-
Persistence across sessions: Frozen panes remain consistent when the Canvas document is saved, reopened, or shared. Viewers who access the shared document will see the same frozen configuration, unless it is specifically changed.
-
Removing the freeze pane feature flag: The Freeze pane feature flag (features.rollout.canvas_freze_pane) can be removed from the Administration Settings, if it is currently active.
Charts
Enhanced Select Element window in Charts
We have enhanced the Select Element window used for configuring chart data in Canvas. These improvements offer a more powerful, flexible, and user-friendly experience when selecting elements from large hierarchies. The updates include advanced sorting options, the ability to select or deselect multiple items at once, features for flattening and unflattening hierarchies, and a one-click option to expand or collapse sections.
-
Sorting options: Users can sort elements in four ways: Default uses the source structure order; Ascending uses alphabetical order; Descending uses reverse alphabetical order; and Custom allows user-defined ordering.
-
Selection controls: Users can now select specific levels and branches in the Select Element window. Furthermore, they can easily manage their selections with a one-click action to Select All or Deselect All items. This enhances the process, making it more efficient and user-friendly.
-
Shortcuts split button for fast selection:A new Shortcuts split button has been added to enable faster and more predictable selection actions. The primary button toggles between Select All and Deselect All, while the secondary dropdown provides advanced hierarchical selection options. The dropdown (opened via the arrow) includes:
-
Select Branch: select all child elements of a chosen parent node (requires a parent selection first). When a parent node (for example, “Germany”) is selected, all its child nodes (such as “Berlin” and “Bonn”) are automatically selected unless they are individually deselected.
-
Select by Level: select elements at a specific hierarchy level across all branches (only available levels are shown).
-
Select Base Level: select all leaf-level elements, regardless of hierarchy depth or branch structure.
-
-
Flatten / Unflatten: the Flatten view displays all elements in a flat structure, removing any hierarchy indentation. The Unflatten view restores the hierarchical nesting of elements.
-
Expand All / Collapse All: this feature allows you to expand or collapse the entire tree structure with a single click.
-
Improved interface for dimensions with aliases: users will now only see the Alias and Alias Format sections when a dimension includes aliases. This provides a cleaner visual for selecting elements.
-
Display mode toggle for element view: users can now switch between viewing only selected elements and the full element tree, making it easier to focus or explore as needed. The new Display Mode option in the toolbar provides two modes:
-
All: displays the complete element tree and enables all toolbar actions
-
Selected: displays only the selected elements, and limits available actions to Expand/Collapse, Hierarchy/Flat List toggle, and Sorting
-
Dynatables
Multiple Element Selection in POV Dimensions
We have added the option for selecting multiple elements in Point of View (POV) dimensions within Dynatables, including both Pivot area of a Dynatable and comboboxes. Users can now select multiple elements and apply an aggregation function directly through the POV combobox, or the Select Element dialog, increasing flexibility when working with dimensional data. Multi-select is enabled when cross drill-down and data entry are disabled in the Settings, which is the default behavior in new Dynatables. In older Dynatables, users must enable multi-select manually.
-
Multiple Element Selection in POV dimensions: users can now select one or more elements in POV dimensions to control which data is displayed in a Dynatable, instead of relying on default dimension behavior. In the Pivot area of a Dynatable, users can select elements via the Select Elements dialog or POV combobox. Multi-selection can be done by selecting multiple elements via clicking on the elements' checkboxes.
When multiple elements are selected, users can apply an aggregation function (Sum (default), Average, Minimum, Maximum). The selected aggregation and number of elements are displayed as tags in the POV area. Selections support aliases, alias formats, subsets, and consolidated elements. Changes are applied immediately upon confirmation, refreshing the table accordingly. When subsets are used, selection is limited to a single element. -
Multiple Element Selection in POV comboboxes: users can now select one or more elements directly within POV comboboxes to control which data is displayed in a view. When multiple elements are selected, aggregation functions (Sum, Average, Minimum, Maximum; default: Sum) appear in the combobox footer and can be applied to the selection. The selected aggregation and number of elements are displayed as tags in the POV combobox .
Sorting table content in Dynatables
Table content can now be sorted in ascending or descending order for both row header columns and data columns. Row header columns can be sorted alphabetically (A→Z / Z→A), while preserving the hierarchy structure. Data columns can be sorted based on numerical values (ascending or descending). Sorting can be applied via mouse interaction or the column menu, and the active sort state is clearly indicated in the column header.
This functionality is available across all contexts, including the main application, Canvas components, drill-anywhere, AI integration, and Power BI integration.
-
Sorting rows by column values in Dynatables: rows can be sorted based on the values in a selected column, allowing quick identification of elements with the highest or lowest cell values, improving data analysis and comparison within the table.
-
Sorting Dynatable content: content can be sorted using multiple sorting types across columns and rows, providing greater control over how data is organized and analyzed. Sorting directions include Ascending, Descending, and Default (to remove sorting).
Enhanced Select Element window in Dynatables
We have enhanced the Select Element window used for configuring Dynatables data. These improvements offer a more powerful, flexible, and user-friendly experience when selecting elements from large hierarchies. The updates include advanced sorting options, the ability to select or deselect multiple items at once, features for flattening and unflattening hierarchies, and a one-click option to expand or collapse sections.
-
Sorting options: elements can be sorted in four ways: Default uses the source structure order; Ascending uses alphabetical order; Descending uses reverse alphabetical order; and Custom allows user-defined ordering.
-
Selection controls: users can now select specific levels and branches in the Select Element window. Furthermore, they can easily manage their selections with a one-click action to Select All or Deselect All items. This enhancement enhances the process, making it more efficient and user-friendly.
-
Shortcuts split button for fast selection:a new split button has been added to enable faster and more predictable selection actions. The primary button toggles between Select All and Deselect All, while the secondary dropdown provides advanced hierarchical selection options. The dropdown (opened via the arrow) includes:
-
Select Branch: select all child elements of a chosen parent node (requires a parent selection first)
-
Select by Level: select elements at a specific hierarchy level across all branches (only available levels are shown)
-
Select Base Level: select all leaf-level elements, regardless of hierarchy depth or branch structure
-
-
Flatten / Unflatten: the Flatten view displays all elements in a flat structure, removing any hierarchy indentation. The Unflatten view restores the hierarchical nesting of elements.
-
Expand All / Collapse All: This feature allows you to expand or collapse the entire tree structure with a single click.
-
Branch-Level Selection: When a parent node (for example, “Germany”) is selected, all its child nodes (such as “Berlin” and “Bonn”) are automatically selected unless they are individually deselected.
-
Improved interface for dimensions with aliases: Users will now only see the Alias and Alias Format sections when a dimension includes aliases. This provides a cleaner visual for selecting elements.
JedoxAI
Knowledge Agent
Powered by advanced AI technology, the Knowledge Agent supports users with guidance and relevant information, all through natural language conversations. From troubleshooting technical issues and supporting and reviewing scripting-based functionalities in Integrator, to guiding you through product features, it is a reliable and practical source of assistance.
Some of the Knowledge Agent’s advantages:
- It works intuitively like any other chat agent
- Supports multi-turn conversations
- Ability to understand natural language
- Context awareness
- Conversation history
- Troubleshooting skills
- Assistance with scripting-based functionalities in the new Integrator UI
Reporting Agent
The Reporting Agent in JedoxAI offers conversational interaction to analyze the user's data that resides in OLAP database. You can iteratively create and update a Dynatable without having to recreate the entire context, as well as obtain a multidimensional detailed analysis of KPI performance for a cell value or KPI card by accessing it via the "Data Insights" option from the context menu.
Among others, the Reporting Agent has as capabilities:
- Data insights for KPI performance commentary
- Attribute support: user can reference entities or accounts by their user-friendly names
- Multi-turn conversations
- Replay a query
- Detailed analysis for multidimensional complex queries
- Conversation history
Integration
New Integrator UI 
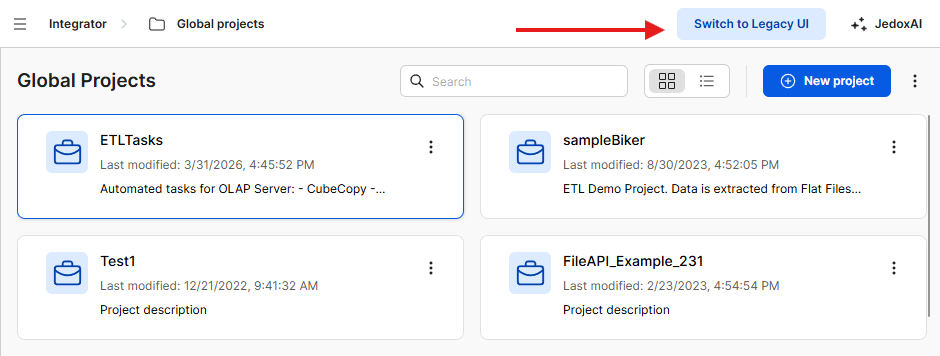
Jedox Integrator has a redesigned interface, built on direct user feedback from surveys and interviews. The new UI brings a consistent look and feel across all component editors, with a focus on usability and efficiency. Read more in New Jedox Integrator UI.
Users can easily switch between the legacy UI and the new UI with the click of a button in the toolbar.
Features exclusive to the new UI
-
Project/component search: search across all projects by component or project name, and filter results by component type.
-
FlowGraph zoom controls: zoom in and out using UI buttons or mouse controls, with a fit-to-screen option.
-
Change FlowGraph direction: the FlowGraph direction can be set horizontally or vertically, left to right or right to left.
-
Component Count: displays the total number of Integrator components in a project directly in the project view.
-
New variable setup: enables on-the-fly creation and editing of variables, $-based assignment, reduced navigation, and support for numerical values.
-
Redesigned Calendar Extract: a restructured interface that reduces the number of steps needed to configure calendar-based extracts.
-
Log Panel: search log history in the Monitor in real time as you type. Works alongside existing log filters.
-
Logs panel view options: view logs at the bottom or the right side of the Monitor window. There is also an option to jump to the latest message.
See New and Legacy UI: Feature Comparison for a detailed listing of differences between the new UI and the legacy UI.
Current limitations
The new UI is not yet feature-complete. Some functionality available in the legacy UI is not yet supported. Features will be added incrementally in upcoming releases; refer to future release notes for details.
Cube Delta Extract
This new extract pulls only the new or changed data since the data was last extracted. It extracts data from an OLAP cube with changes done between two time periods (i.e., a Delta). This feature is Early Access and available upon request only. Contact your Jedox sales rep for details.
New functionality in JSON Extract
The new functionality allows looping at different levels in a JSON file.
Python function
This new FieldTransform function supports the use of Python language for data transformation. The Python function uses Python 3.
External Job: changed behavior
If the project containing an external job is in a namespace, and a model is specified in the job's scope, then that model must be in the same namespace.
Models
Simplified model licensing across environments
Financial Consolidation model licenses can now be shared across development (DEV), quality assurance (QA), and production (PRD) environments for the same customer. This simplifies model migrations by allowing complete databases to be transferred between environments, reducing manual migration steps and improving deployment consistency.
OLAP
New option to disable auto-loading of archived databases
A new context-menu option disables auto-loading of archive databases, lowering the memory consumption of the server and improving performance.
Use of GET request deprecated for OLAP Server login
OLAP Server login request no longer supports HTTP GET requests to /server/login. Integrations should be updated to use POST instead. See OLAP API and Server Browser documentation for details.
Updated components
In Jedox version 2026.1, the following components were updated:
| Component | Version |
| Apache | 2.4.66 |
| PHP (Apache) | 8.3.0 |
| PHP (SSS) | 7.3.33 |
| PHP (SVS) | 8.3.3 |
| OpenJDK | 21.0.5 |
Updated July 21, 2026