The Predictive Forecasting Wizard guides you through the simple, three-step process of bringing predictive forecasting technology to your custom work environment. Start by choosing the Time Series Wizard from the Start Page. This will open the Time Series Prediction Overview.

Prediction Overview
The overview shows the cubes equipped with predictive forecasting. You can also see their database and information relevant to their forecast.

On each wizard page, you will find videos and tutorials explaining each step and report.
The fields of the Prediction Overview are described below:
| Field | Description |
| Select Database | A dropdown of all databases stored in your Jedox instance. The database is your native work environment populated with custom data. We also provide demo data to allow you to familiarize yourself with driver analysis functionality outside of your own work environment. |
| CUBE (DB) | You may choose any cube for predictive planning purposes, so long as it has at least three dimensions that AIssisted™ Time Series Prediction can utilize as the Time, Version, and Measure dimension. The database is your native work environment populated with custom data. We also provide demo data to allow you to familiarize yourself with predictive forecasting functionality outside of your own work environment. |
| SCENARIO | Shows the saved scenarios for each cube. This can be used to create different time series prediction setups for the same cube. |
| ALGORITHM | AIssisted™ Time Series Prediction uses a number of different algorithms. Each calculates predictive output for your actual data in a unique way. The Best runs through every algorithm possible and chooses the predictions from the algorithm with the best training accuracy. Alternatively, you can prescribe a specific algorithm (Liner Model, Holt Winter, etc.). |
| LAST STARTED | Shows the last time each cube's forecast was started. |
| PREDICTIVE range | Shows the start date, end date, and duration (in months) of the time period undergoing the predictive forecast. |
| SHOW (button) | Shows a preview of the populated data and compares the actual data with your predicted data. It also provides you with an accuracy percentage. |
| START (button) | Runs predictive forecasting for your cube. |
| COPY (button) | Allows you to copy an existing scenario by selecting it from the list of the "Copy Scenario" dialog, or add a new scenario, which will then appear in the "Scenario" list for selection. Click the Save Changes button to confirm the task. |
| EDIT (button) | Allows you to adjust the input data of the cube (e.g. change the predictive range, use a different algorithm, or chose different dimensions/elements). |
| REMOVE (button) | Removes the AIssisted™ predictive scenario and/or prediction values for the cube. Removing only the scenario will allow you to keep prediction values, while removing values will keep the scenario intact. You may also remove both. Click Close in the window once you are finished. |
| SCHEDULE (icon) | Shows a clock icon if the scenario has the scheduled option checked. Click on EDIT to change this option or go to Jedox’s Scheduler section to edit the frequency of the analysis. |
| STATUS (button) | Displays the status of the Integrator job after you start it. To see eventual changes, click the refresh icon in the "Status" column. Once finished, it will show a different icon with the results. Click on the icon for more information. |
| New Setup (button) | Adds new AIssisted™ predictive scenario for a cube. |
| Manual Settings (button) | Used to change prediction setups and scenarios without entering the wizard itself. Read more about it in Manual Settings for AIssisted™ Planning. |
Click New Setup to make a predictive forecast. The wizard will guide you through the necessary steps.
General Details
Enter a scenario name for the prediction in order to continue.
Choose the database and cube on which you would like to perform the prediction. The selection will indicate with a green or red message box whether the selected cube is validated for the analysis, i.e., whether it has the required dimensions. A validated cube must have a Time dimension, a Version dimension, and a Measure dimension.
Click the Advanced Settings button to access the dimension type assignments. There you can also tag the dimensions with Version and Measure dimension if your cube is not validated.
Note that the Time dimension cannot be tagged. If a Time dimension is not available, the cube cannot be validated.

Once you have selected a validated cube, click Confirm Selection and then Save & Next. If you wish to abort, click Close to return to the overview.
It is recommended to not use dimensions that contain special characters in their names (e.g. , / $), as these can cause problems when using the wizard.
Narrow down your selection to a specific data slice.

The essential components of this slice are the Time, Version, and Measure dimensions, located in the upper section of the wizard.
The Reset to default button dynamically selects the first and last date elements as well as the topmost elements for additional dimensions or the dimension's read element.
You may also select your source material manually. Simply select the duration of the Time dimension from the comboboxes, being sure to choose the time level at which your data resides. For example, if your data is daily, choose a daily date, e.g. 2022-01-01.
If you would like to schedule your predictions to run on a certain interval with the newest data, click the checkbox Use last month as end date.
Click the adjustment icons (![]() ) to select the rest of your source material, which can include multiple elements per dimension.
) to select the rest of your source material, which can include multiple elements per dimension.
When setting your prediction source, more specific element selections may result in more accurate predictions.
The Settings for other dimensions, found in the lower section, will further fine-tune your prediction.
The default mode for other dimensions is set for onlyNodes, and it is recommended that first the predictions be run with the onlyNodes mode.
• The amount of data may cause your predictions to take a long time
• The data could be sparse and cause the predictions to fail or perform poorly
• Predictions at this level may also blow up the cube's volume
When choosing onlyBases, consider how many base level elements each of your consolidated elements has. If an element has 3000 base level elements, choosing onlyBases may cause the volume to be too large, which might cause the setup to fail. It is recommended to break the setup into several different scenarios.
When analyzing data, onlyNodes uses exactly the elements you specified for the prediction. For example, if you specify "All Regions" in the Region dimension, a time series from the consolidated element "All Regions" is used as the source data. In contrast, using onlyBases causes the prediction to be calculated for each base element under the selected (consolidated) element. For example, if you select "All Regions" and under this consolidated element are the children Germany, Austria, and Switzerland, these three base level elements would then be used as the source data. The results are calculated for these three time series and then written back to these three time series. Since the inputs for the two methods are different, the resulting outputs would also be different.
The View Source button allows you to view the source data before going through the prediction process. After entering your parameters, click on this button, and a preview window will pop up, showing how the source data looks. In case of gaps or extreme values, it can be helpful to use the Outlier detection in step 2, or the AIssisted™ Data Preparation Wizard.

If you are satisfied with the data, just close the "sourceView" window and continue with Save & Next.
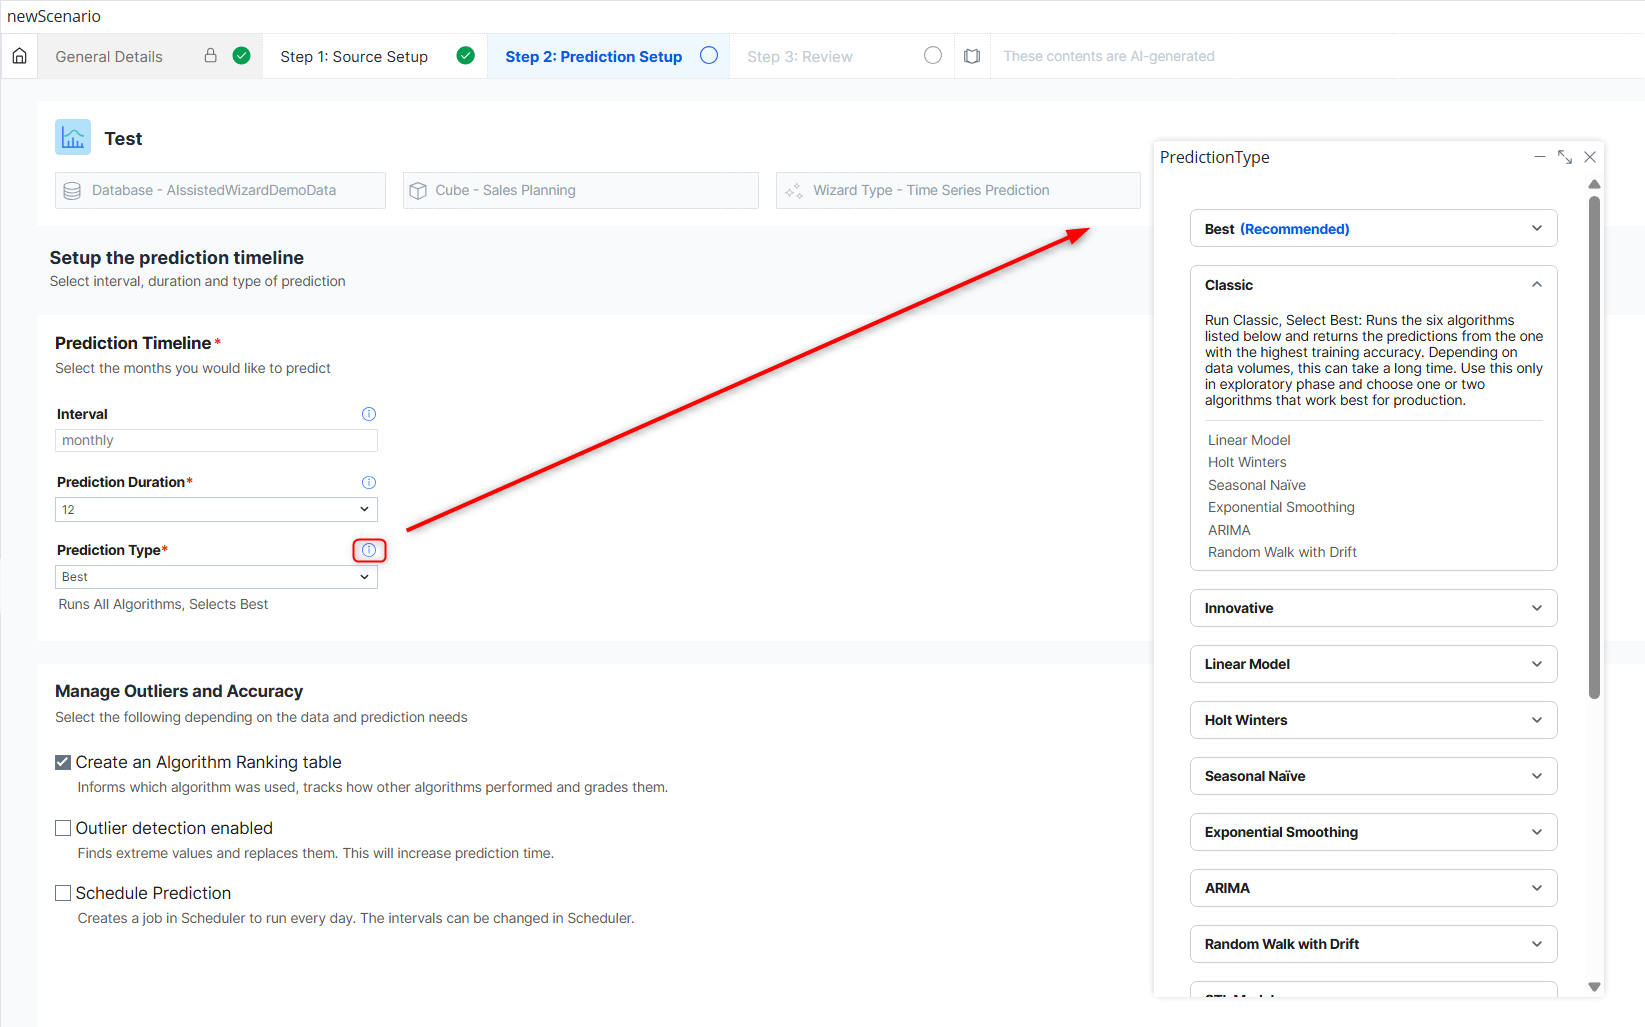
Now you must select the prediction properties, namely the prediction interval, duration, and type.

The prediction interval is derived automatically from the start and end dates in the previous step. If the interval is incorrect, go back and adjust it. You can choose a prediction duration of 1 to 24 months.
There are various prediction types, each with different algorithms. The Best prediction type runs all algorithms and returns the results from the algorithm that performed the most accurately during the training phase. The Classic prediction type runs statistical methods, while the Innovative prediction type implements machine learning. If you set a custom algorithm selection in the Manual Settings (e.g., three values such as “1,5,7” instead of one or a default grouping), the Custom prediction type will be available for selection, allowing you to retain the information from the Manual Settings instead of overwriting it with one of the default selections.
Clicking on the info icon next to the prediction type will display a pop-up dialog with detailed information about each algorithm:
Select the checkboxes to apply either of the predictive management tools:
-
Algorithm Ranking table: this will create an
Accuracycube and store the accuracy of the prediction for the chosen algorithm. When the type Best is selected, the accuracy values for all algorithms are stored and the results of the algorithm with the highest accuracy are returned. The table can be viewed in the Prediction Preview. -
Outlier detection: controls extreme values in the source data, which can often times help provide more accurate input data.
-
Schedule Prediction: schedules a job for the prediction to be executed at a given interval. Note that you must have checked the Use last month as end date checkbox in step 1, in order for the latest data to be used for the scheduled job. Otherwise, the data will be executed repeatedly with the specified interval. The default frequency is once per day, but you can customize the length of your prediction intervals in the Scheduler.
Once you have selected your prediction properties and chosen the predictive management you wish to apply, click Save & Next.

The next step summarizes your scenario and displays a small review of your source data. If the review is empty, some source data may be missing, which can lead to inaccurate predictions or no predictions at all. Double-check in step 1 if everything is set correctly.
You can choose to save and execute the Time Series Prediction or simply to save your prediction settings. Either way, your prediction for this data set will be displayed in the prediction overview. There it can be viewed, modified, and executed at any future point.
Once executed, the data automatically becomes available in the cube and can be implemented in reports and templates.
Time Series Prediction Wizard with R services
Time Series Prediction Wizard setups all use Python services by default since December 2023 with version 23.4.0. The R services will continue to run, however the Integrator jobs that connect to those services in the Time Series Prediction Wizard will no longer be maintained after version 25.1.2.
No action is required with setups created with Wizard version 23.4.0 or later. You can double check whether you are using R or Python in the Manual Settings for AIssisted™ Planning. See screenshot below:
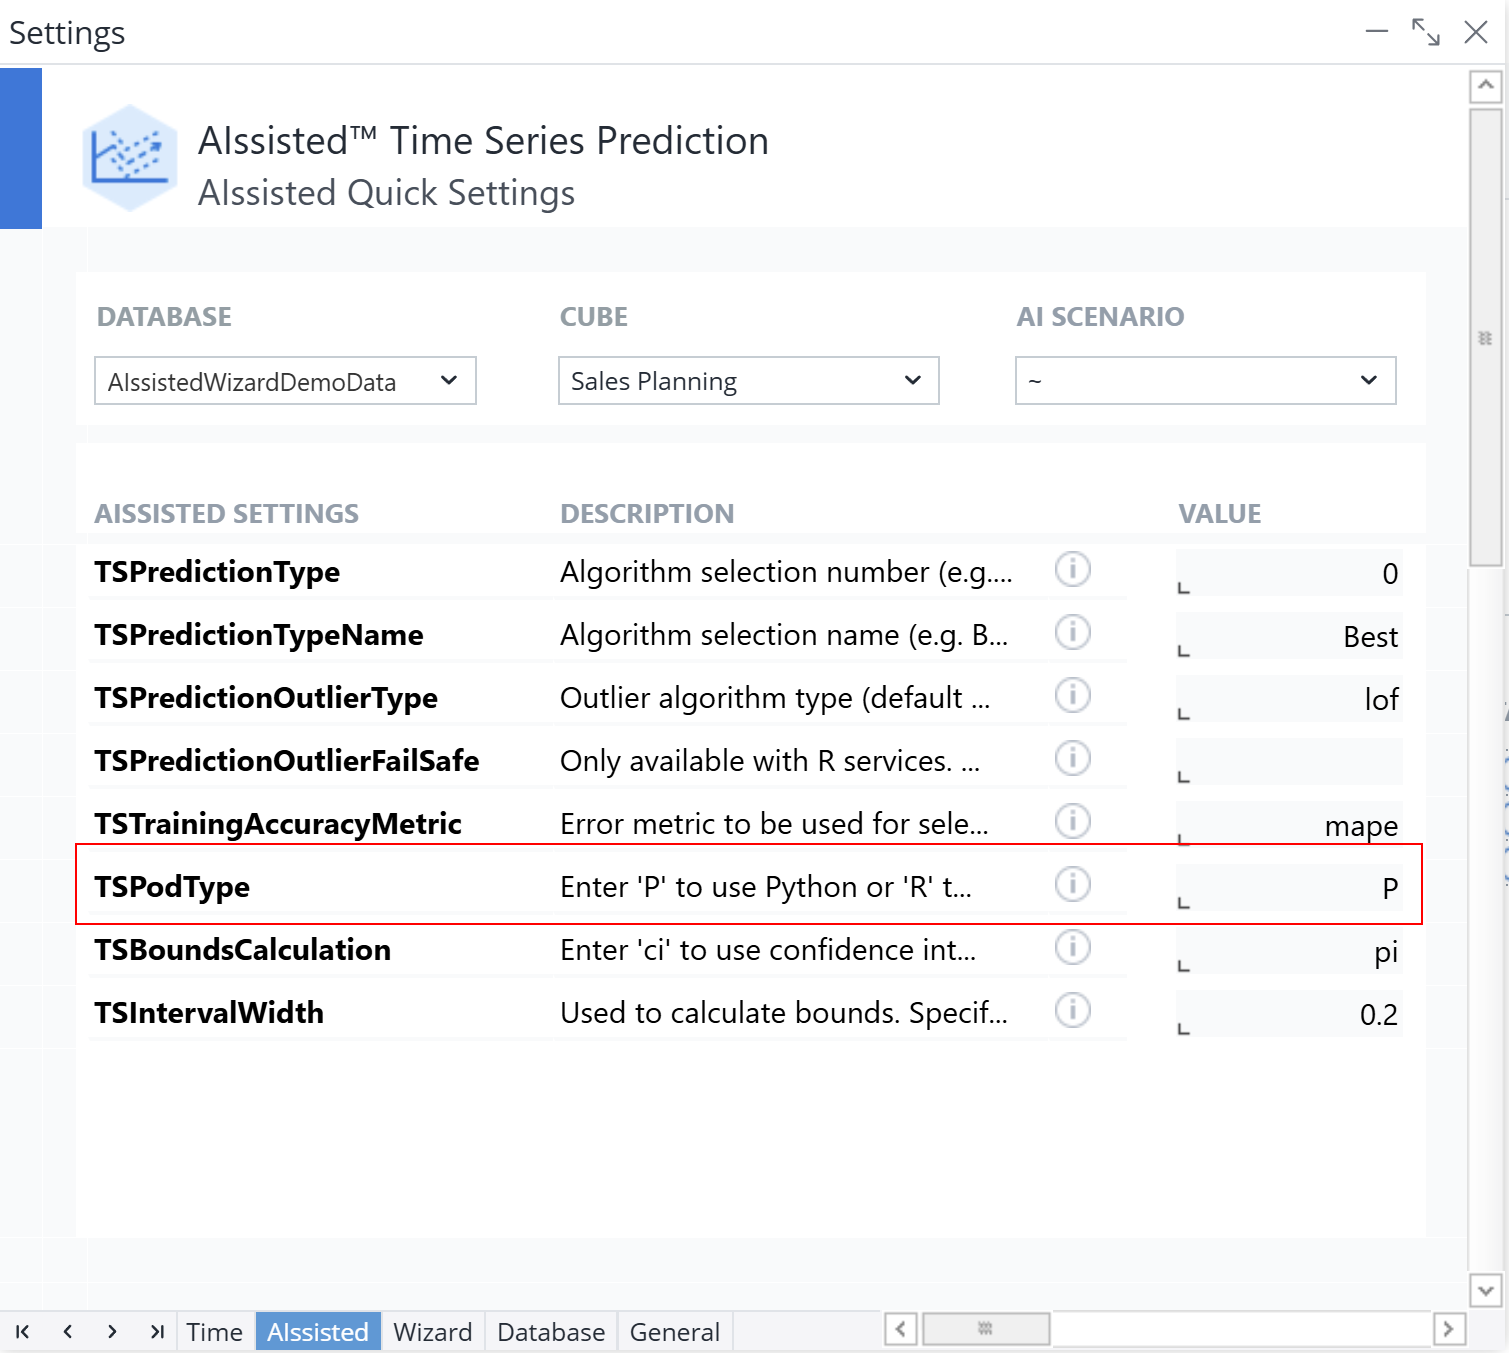
For setups created before then, to be sure you are happy with the results, create a copy of the scenario so you can compare results. After it is copied, go to "Manual Settings", AIssisted sheet, and change the TSPodType to P. (Be sure the database, cube, and scenario drop-downs are correct.)
Then open the newly created Wizard scenario and change the prediction target version (to ensure you don't write over the R results). Click through to the end and execute.
Compare results. Bounds will likely be narrower because the calculation is different. What we are pulling from the service is called a confidence interval, which is highly dependent on the data and the algorithm used. It is so much narrower because it is giving its most confident calculations. With R, these bounds were more or less calculated in a static way (20% up or down with an additionally smaller percentage added to this calculation, depending on how far out it was into the future).
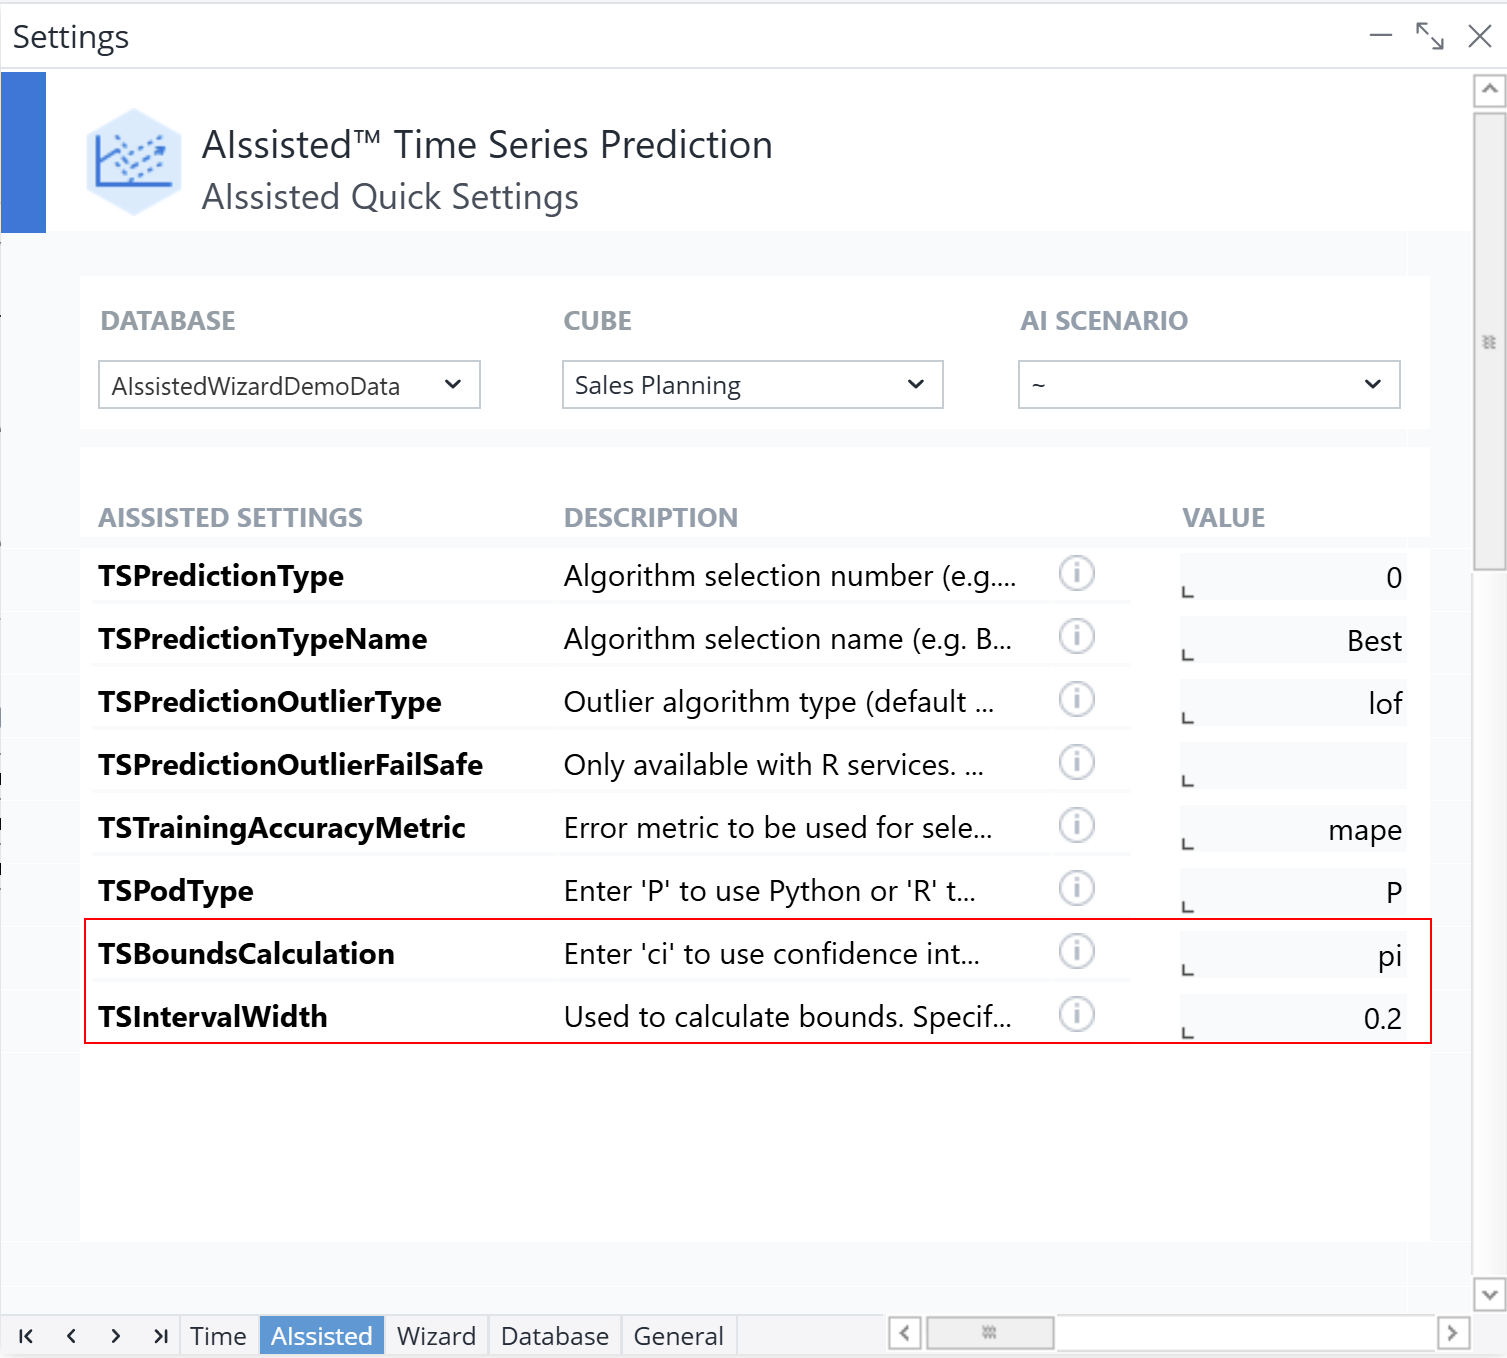
There is also another calculation the Python service does that ends up returning a larger interval that would be more similar to the R service values we are used to seeing, which is called the prediction interval. You can change which calculation the Wizard takes by adjusting the TSBounds calculation value in the "Manual Settings" report on the AIssisted sheet. You can also adjust the interval width easily from the "Manual Settings". At this point, the default is set at the recommended 0.2 interval.
When you are happy with your results, delete the old scenario with the R services and schedule the new scenario (if applicable).
Updated April 29, 2026