Once you generate a forecast, the AIssisted™ Time Series Prediction Wizard takes your source data and calculates prediction data. The AIssisted™ Prediction Preview then shows these two data types for comparison, along with table, graph, and accuracy percentage.
Once you have defined a particular area of a cube using the Wizard, the Prediction Preview shows the figures of the data populating this area. Choose the Measure and Version (Comparison) from the comboboxes to compare them with the prediction data.
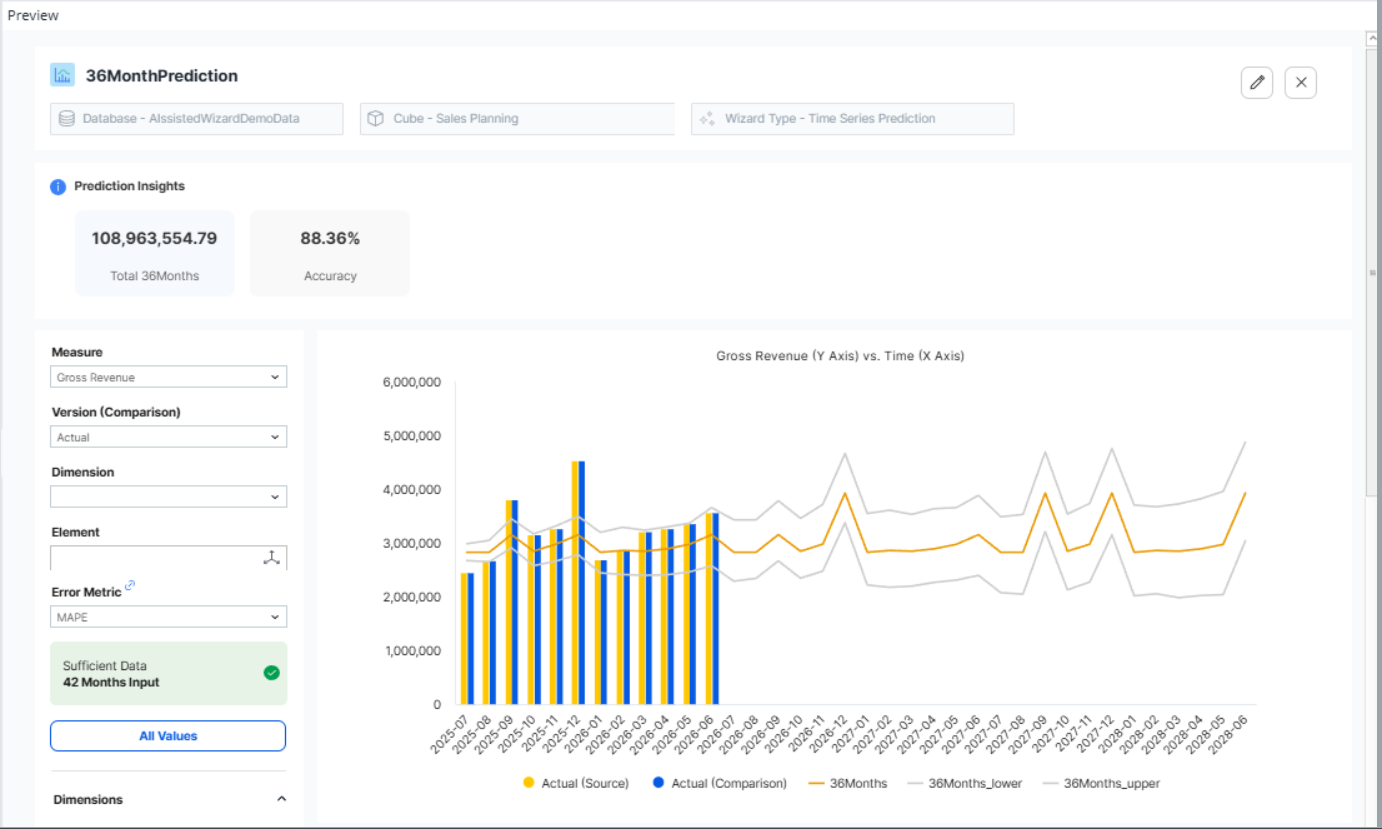
The example below shows the predicted forecast for Gross Revenue, with Actual chosen as the comparison dimension:

You see the predicted values along with their upper and lower bound values as lines, with the Actual and the Version (Comparison) shown as bars. You can display different data by choosing a different Measure or Version (Comparison) from the comboboxes. If you select a version other than Actual, the dark blue bar will change depicting the Comparison measure. You can hide a line in the graph by clicking on the corresponding, color-coordinated labels below the graph.
The KPI cards at the top of the graph display the numbers for the Total Predictions, Total Actual, Difference, and Accuracy in percentage. These numbers correspond to the numbers shown in the table below the graph. The KPI cards for Total Actual and Difference are only displayed if the Actuals and Prediction counts are the same, ensuring that you are comparing "apples with apples". For example, if you predict 36 months into the future, but you only have 12 months of actual data, these two values would not be compared.
The fields and functionality of the Prediction Preview are described below:
| Field | Description |
| Measure (combobox) | Choose the Measure element you wish to use for your predictive forecast (e.g. Gross Revenue). You can select different Measure elements to show different prediction results. |
| Version (Comparison) (combobox) | Choose the Version (Comparison) element you wish to use to compare with your prediction data (e.g. Actual). It is possible to select different Version (Comparison) elements to compare with the predicted data; for instance, you can compare the accuracy of prediction of a given measure from the Actual to the Budget. |
| Error Metric | If the Source Version element contains additional values, you can choose different metrics to evaluate the accuracy of your predictions. For more information on how these are calculated, see this blog post. |
| All Values (button) | Shows the overall view of the source data as well as predictions. This can be useful to compare predictions to the previous months of actual data. In this view, all values can be seen by clicking on Show source values. To return to the prediction view, simply click on the View Results button. |
| Actual (source) | The actual figures for the duration of your prediction. It is what your prediction compares itself with to determine its accuracy. The source is always the data you entered from the Version dimension, e.g. Actual, and will always be expressed in the table and graph. |
| Actual (comparison) | This is a dynamic figure that compares to the predicted forecast. Note: a change in the Version (Comparison) element will be reflected in the table and graph. If you switch it from Actual to Budget, the field in the table will become Budget (Comparison), and Budget will be shown in the graph. |
| Prediction | The forecast data produced by the AIssisted™ Time Series Prediction Wizard. |
| Prediction_lower | The lower bounds of your prediction data, i.e. the lowest point your data is expected to sink below the predicted forecast. |
| Prediction_upper | The upper bounds of your prediction data, i.e. the highest point your data is expected to rise above the predicted forecast. |
| Accuracy (prediction vs. source version) | The relative accuracy of your prediction and its Source Version, expressed as a percentage. |
|
Accuracy (source vs. comparison) |
The relative accuracy of your prediction and its Comparison Version, expressed as a percentage. |
| Difference | The difference in accuracy between the predicted data and the source version as defined in the original setup. |
Note: although you can make a predictive forecast based on fewer than 36 months of data, we strongly suggest 36 months as a minimum for optimal accuracy.
Adding prediction values to reports
AIssisted™ Time Series Prediction values are populated into the same cube you used as your source data, simply in a new version element you stored them in, with Prediction being the default element.
Updated April 29, 2026