Return to Financial Consolidation Model Overview.
A Group GAAP Corrected breakdown report is a report that provides detailed information on Local GAAP to Adjustment, transaction, correction to Group GAAP corrected
The report typically includes information such as balance sheet and income statement items and any adjustments made to align the subsidiary's financial statements with the parent company's.
Report Heading
The report heading updates dynamically as various reporting options are selected. Below it shows the Version, Month_YTD, Scope, and Currency dimensions. (Actual 2020-12_YTD, Total Group,~, Not applicable, Local Currency (~) ):
The logo can be changed in Administration; see Configuring Design Elements for more on report design.
You can select your base elements in the Comboboxes below the report heading:
The Version dimension separates actual figures from planning figures, see full article. The Month_YTD dimension accumulates float values from the beginning of the calendar year to the current date, while respectively holding the final figure for stock values, see full article. The Scope dimension contains all target elements for financial consolidation in a flat list, see full article. The Legal Entity dimension represent the companies within a group hierarchy, see full article.
The check-boxes below allow you to customize the appearance of your report:
- Click
Show Account No.if you wish to display the account number prior to the account name (e.g.Total property, plant and equipment→110100 - Total property, plant and equipment). - Click
Show Two Decimal Placesif you wish to show the figures in double-decimal form (e.g.2,947,066→2,947,066).
Table Columns
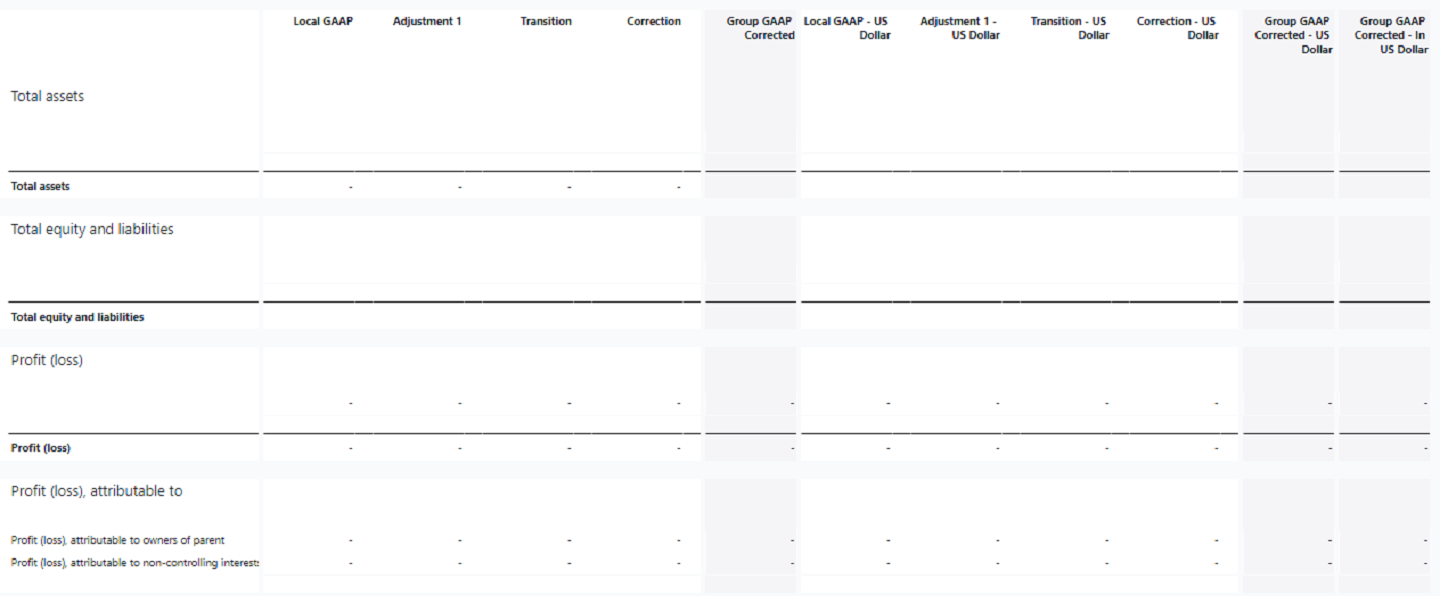
The Group GAAP Corrected Breakdown report displays different aspects of the base elements you select in several tables. It first shows balance sheet line elements like Assets and Liabilities and then shows Profit and Loss elements. The columns displayed in the report depend on the the selection made in the PoV area:
The table breaks down into three parts. Above we see the Total assets section, which shows the assets accounts. There are also sections for Total equity and liabilities, and Profit (loss).
| Field | Description | Implementation |
Combobox for Version, Month_YTD, Scope , and Legal Entity |
Current POV Selection for filters needed. |
Shows Combobox filters to choose |
| Row data | Elements from Balalnce sheet and PnL | Row names include Accounts from Balance Sheet and PnL dimension |
|
Column Header |
Includes Local GAAP, Adjustments, Transition, Correction, Group GAAP Corrected and then the same Data in US Dollars | Data would include Local GAAP, Adjustments, Transition, Correction, Group Gaap Corrected, and then the same Data in US Dollars based on POV Selection of Version, Month_YTD, Scope , and Legal Entity |
Updated July 3, 2025


