Return to Financial Consolidation Model Overview.
A consolidated financial statement is a report that combines the financial information of a parent company and its subsidiary companies into a single report as if they were a single entity.
The information is presented in a way that eliminates intercompany transactions and accounts for the parent company's ownership stake in the subsidiary.
Report Heading
The report heading updates dynamically as various reporting options are selected. Below it shows the Version, Month_YTD, Entity, and Currency dimensions. (Actual 2020-12_YTD, Bikers Best Nippon, Local Currency (JPY) ):

The logo can be changed in Administration; see Configuring Design Elements for more on report design.
You can select your base elements in the Comboboxes below the report heading:
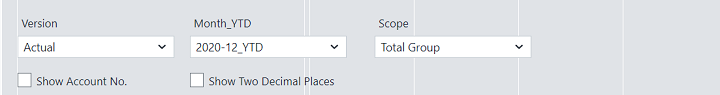
The Version dimension separates actual figures from planning figures, see full article. The Month_YTD dimension accumulates float values from the beginning of the calendar year to the current date, while respectively holding the final figure for stock values, see full article. The Scope dimension contains all target elements for financial consolidation in a flat list, see full article.
The check-boxes below allow you to customize the appearance of your report:
- Click
Suppress Zero Linesif you wish to hide the fields in your report with no data (if you select this option all, all available transaction types will appear: those without data will have a dash in place of numeric input). - Click
Show Two Decimal Placesif you wish to show the figures in double-decimal form (e.g.2,947,066→2,947,066).
Table Columns
The Consolidated Financial Statement report displays different aspects of the base elements you select in several tables. The table includes Balance Sheet elements found income statement items. The columns displayed in the report depend on the the selection made in the PoV area:

The table breaks down into three parts. Above we see the Total property, plant and equipment section.
| Field | Description | Implementation |
| Combobox selection | Current POV selection for filters needed. |
Shows Combobox filters to choose |
| Row data | Elements from Balalnce sheet | Row names include accounts from Balance Sheet for PY and current year based on POV selection. |
|
Column |
Shows data for Business Combination elements. | Shows data for PPE. |
Data Validations
The report has the following data validations:
-
Vertical data validations are applied to the first part of the report where the Legal Entity view is depicted. If the difference between
Total AssetsandTotal equityand liabilities exceeds a predefined threshold, both figures are highlighted in red. -
Horizontal data validations are applied to the
Consolidated Financial Statement Adjustedfigure. If the difference between theCombined Financial Statementand different kinds of adjustments (Capital Consolidation,Debt Consolidation,Elimination of Unrealized Profit on Inventory,Expenses and Income Consolidation,Manual Consolidation Bookings, and other adjustments) exceeds a predefined threshold, the figure is highlighted in red.
Updated March 30, 2026