Jedox was originally developed as a database and an add-in for Microsoft Excel. Its core component is a cell-related, in-memory OLAP database that is multidimensional and hierarchical. Jedox also has an automatic attribute management. But what do these terms mean in detail?
Jedox is cell-related
When you query a relational database, the smallest obtainable result is a data record (normally composed of several fields). When you start a query in Jedox, the result is a single cell value. In other words, Jedox thinks in terms of cells instead of data records. This is what makes Jedox so compatible with Microsoft Excel, since Excel is cell-related as well.
Jedox is an in-memory database
Jedox OLAP Server is an in-memory database, which means that the database is totally loaded into memory. Jedox is speed-oriented: data queries to basic cells and sum total cells are performed in real time. Results should be shown in milliseconds (or seconds at the longest). Note that requests related to features like file transfer, data import / export, as well as reporting and splashing on high aggregate levels with complex rules may take longer.
The response time guaranteed by Jedox for core functions is less than 3 seconds in 95% of requests.
Jedox is multidimensional
Multidimensionality is an alternative way of organizing data in a database. Unlike a relational database, which uses structures such as tables, data records, and fields, a multidimensional database uses cubes, dimensions, and cells.
You know what a cell is, but what is a dimension, and what is a cube? To answer these questions, it makes sense to take another look at Microsoft Excel.
In the next screenshot you will find a table with a list of row titles in an Excel sheet:

In Jedox, this list shows one dimension of data. Basically, a dimension is a category, such as products, regions, customers or months. In Jedox the above Excel list would be modeled as a dimension with the name "Products". So far in our Excel example, we have the elements of one dimension on the sheet.
Now we are going to add another dimension: a horizontal list of months, which you can see in the figure below. This dimension is called "Months" in Jedox.

That brings us to an interesting point. What do you do in Excel if you want to arrange your data in more than two dimensions? You could add tables to generate a third dimension for example, by storing product names in tables and consolidating them into a product group in yet another table.
But then what? An Excel-worksheet only supports three dimensions. We know from experience that large organizations or companies generally require five to ten dimensions to display their data in line with their requirements.
This is one of the reasons why Jedox was developed. Jedox supports up to 250 dimensions. It helps to structure data in a much more detailed manner than with Excel alone. In Jedox, dimensions can be combined in a specific way, which results in the creation of cubes. Let’s take a look at a cube.
As an example we will use our two-dimensional model that we developed in Excel. The cell range is defined by the dimensions "Products" and "Months" (range C11:N25). It is composed of individual cells, and each of these cells has its own address (e.g., D12). This cell range is called a two-dimensional cube in Jedox, indicated in yellow below.

In principle, a cube is a collection of cells that are defined by two or more dimensions. Now the question remains: how do you access and display data from a multidimensional cube if Excel is only capable of displaying two dimensions on a worksheet at a time?
To answer this question, we first need to take a look at the way a cell is referenced in Excel. Excel uses a simple naming scheme for its cells called the A1 style. Applying this style to our example, the cell address for "Desktop Pro" in February is D14 (see above). In a Jedox data cube, the cell address uses a descriptive value rather than simple letters and numbers. In our example, the address of the cell would be "Desktop Pro", "Feb".
Jedox uses a special database function called "PALO.DATA" to display data from a Jedox cube in Excel. The following formula applies this function to pull a value from a multidimensional data cube into an Excel cell:
=PALO.DATAC("Servername","Cubename","Desktop Pro", "Feb")
In addition to the server name and cube name (which will be explained later), this example formula contains two dimension coordinates ("Desktop Pro" and "Feb"). The data formula can, of course, call up more than two dimension values. For example, the formula to access a five-dimensional cube it might appear as follows:
=PALO.DATAC("Servername","Cubename","Desktop Pro","Feb","2006","Europe","Units")
The following image shows how data from a six-dimensional cube are displayed in an Excel worksheet using a six-dimensional data formula:

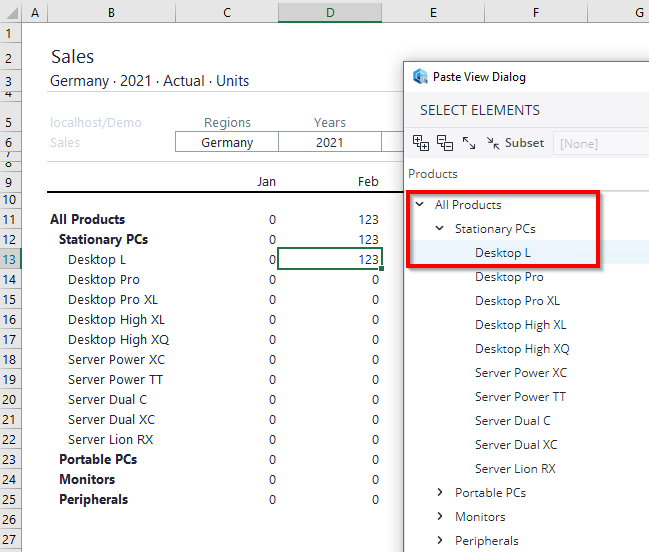
In the formula bar, you can see that the formula references not only strings in the row and column titles to get some of the coordinates, but also cells that are at the top of the page (cells C5, C6, D5, D6, E5, E6, F5, and F6). These cells contain the dimension names and their coordinates for those dimensions that could not be displayed as row or column titles. The entries in C6, D6, E6, and F6 are called page selectors. Using these page selectors is one way to display views of a multidimensional database in a two-dimensional spreadsheet grid.

Double-clicking on a page selector opens a dialog showing all of the available element options for that cell (see figure above). You only have to change the contents of the page selector cell to see the data for a different region or year. As a result, you can display partial quantities of larger data stocks using a single Excel worksheet. Think of how many worksheets you would need to display the same quantity of data using just Excel!
Finally, we want to explain how to enter values into a database. This is actually very easy: you simply click on the desired cell, enter the data, and press the Enter, Tab, or arrow keys. Jedox ensures that the value is automatically saved to the specific cell in the cube. After that, Jedox restores the original formula, which then shows the new value.

Important note: never delete the content of a cell before entering new data! Doing so will clear the formula bar for that cell and thus delete the PALO.DATA function, which Jedox needs to call up the data. When entering new values, simply go to the desired cell, input the new value, and then press Enter, Tab, or an arrow key. Jedox will apply the new value to the PALO.DATA formula and generate the desired data.
Working with hierarchies
When looking at the last screenshot you might be wondering why the values for "Desktop L", "Stationary PCs" and "All Products" all display the number 123, although we only entered the value for "Desktop L" in cell D13. The answer to this question is hierarchical aggregation. The dimension "Products" is not just a basic list.
When we created the dimension in the Jedox database Modeler, we defined a hierarchy which looks like this:
The use of hierarchies in defining a dimension increases the functional capacity of the Jedox data cube. A cube can create multidimensional sums using hierarchical dimensions. Consequently, you do not perform these calculations using Excel formulas. Instead, you pull the aggregated values directly from the cube.
See also: Data Limits in Jedox
Updated April 29, 2026