SUCCESS charts are business graphics that are based on the principles of "information design" by Prof. Rolf Hichert. SUCCESS is the abbreviation of SAY, UNIFY, CONDENSE, CHECK, ENABLE, SIMPLIFY and STRUCTURE. You can find further explanations about SUCCESS rules at www.hichert.com.
You can use the same data sources as for normal charts, see Data Sources.
The following SUCCESS chart types are available:
- Simple bar charts
- Column deviation charts
- Line charts
- Waterfall charts
- Bubble charts
You can find samples of SUCCESS charts in the the Chart Samples Model from Jedox Marketplace.
These charts are available in both Jedox Excel Add-in and Jedox Web, and they can be transferred between the two. You can also display SUCCESS charts from XLSX snapshots in Excel without Excel Add-in.
The examples below show you how to create SUCCESS charts both in Excel and in Jedox Spreadsheets. However, in workbooks with static data where you don't use any excel formulas, SUCCESS charts are not automatically updated when the data source changes because Excel does not recalculate the workbook. As a workaround, we recommend creating a formula in the workbook to enforce a recalculation, such as using the TODAY() function in any cell.
Formatting a SUCCESS Chart
You can format SUCCESS charts and customize each category after inserting them in a workbook. In Excel, make sure you select the chart and click SUCCESS Charts to display the buttons that allow you to format it. To display these buttons in a Jedox Spreadsheet, right-click the chart and go to Format Chart Properties.

You can configure the following elements of the SUCCESS Chart:
| Message | Allows you to configure the title of the chart and the information displayed in the header. You can select the data source from the workbook or type in the information you want. You can also configure the font. |
| Footer | Allows you to configure the information available in the footer. You can select the data source from the workbook or type in the information you want. You can also configure the font. |
| Axes | Allows you to configure the range of the axes. You can set the minimum and maximum range to auto or use a fixed range. |
| Chart | Allows you to change the size (width and height) and position (left and top) of the chart. |
| Plot Area | Allows you to change the size (width and height) and position (left and top) of the plot area. Can be set to autosize. |
| Marker Line | Allows you to set the start and end position for the marker line. You can also select the data source of the marker label (or type in the information you want). Additionally, you can select the color of the line. |
| Base Line | Allows you to select the width and color of the base line. |
| Bar | Allows you to select the width and font for the bars of a chart. Additionally, you can select the colors of the bars. |
| Subtotals | Allows you to select the data source of the subtotal bars, as well as various design configuration options. Available only for Vertical Waterfall SUCCESS Charts. |
| Bubble | Allows you to set the color and border color of the bubbles in a bubble chart. Only available in a Bubble chart. |
| Separator Line | Allows you to set the position of the separator line in a chart. Additionally, you can set the color and the size of the separator line. Only available in Deviation Column SUCCESS Charts or in Line SUCCESS Charts. |
| Line 1 |
Allows you to set the width, font and color of the first line in the chart. Only available for Line SUCCESS Charts. |
| Line 2 |
Allows you to set the width, color and design of the second line in the chart, before and after the separator. Additionally, you can set the font for the numerical values. |
Creating a Waterfall Chart
To create a Waterfall Chart, follow these steps:
- In the data source, select the G8:T9 area:

- On the Jedox ribbon, select the Success Chart button.
- Choose the Waterfall chart type and click Create. The chart is displayed.

- Select the chart and click on the SUCCESS Charts one more time. The following SUCCESS Charts window is displayed, allowing you to make setting for various areas of the chart.
- Select G5 for Message and G6 for Title in the Header section. You can also choose different font settings by clicking the button on the right.
- In the Footer section, select G14 as data source.
- Click Update. The result looks like in the example below:


Creating a Vertical Waterfall Chart
To create a Vertical Waterfall Chart, follow these steps:
- In the data source, select the F9:G27 area.

- On the Jedox ribbon, select the Success Chart button.
- Choose the Waterfall chart type and click Create. The chart is displayed.

- Select the chart and click on the SUCCESS Charts one more time. The following SUCCESS Charts window is displayed, allowing you to make setting for various areas of the chart.
- Select G5 for Message and G6 for Title in the Header section. You can also choose different font settings by clicking the button on the right.
- In the Footer section, type "Bikers Best AG".
- In the Subtotal section, select J23 as a source for the Subtotal Bars.
- In the Marker Line section, set the start and end position of the marker line to 10 and 12 respectively.
- Select the cell J25 as a source for the Marker Label.
- Click Update. The Vertical Waterfall SUCCESS chart is displayed:


Creating a Bubble Chart
To create a Bubble Chart, follow these steps:
- In the data source, select the G7:J17 area.

- On the Jedox ribbon, select the Success Chart button.
- Choose the Bubble chart type and click Create. The chart is displayed.

- Select G5 for Message and G6 for Title in the Header section. You can also choose different font settings by clicking the button on the right.
- In the Footer section, type "Bikers Best AG".
- In the Marker Line section, set the X and Y position of the marker line to 0.50 and 0.10 respectively. Set both lines as dash lines.
- Click Update. The SUCCESS Bubble Chart is displayed:


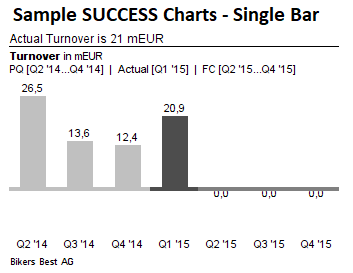
Creating a Single Column Chart
To create a Single Column Chart, follow these steps:
- In the data source, select the F6:M7 area.

- On the Jedox ribbon, select the Success Chart button.
- Choose the Single Column chart type and click Create. The chart is displayed.
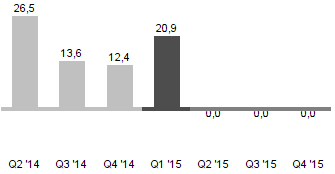
- Select G8 for Message and G9 for Title in the Header section. You can also choose different font settings by clicking the button on the right.
- In the Footer section, type "Bikers Best AG".
- In the Bar category, set the actual areas from G25 to G26.
- Set the design for previous, actual and forecast data.
- Click Update. The SUCCESS chart is displayed.

Creating a Line Chart
To create a Single Column Chart, follow these steps:
- In the data source, select the F10:R12 area.

- On the Jedox ribbon, select the Success Chart button.
- Choose the Line chart type and click Create. The chart is displayed.

- Select G5 for Message and G6 for Title in the Header section. You can also choose different font settings by clicking the button on the right.
- In the Footer section, type "Bikers Best AG".
- Configure the separator line as follows: Position: G17, Height: 5, Width: 2, Color: Gray
- Click Update. The Line SUCCESS Chart is displayed.


Creating a Deviation Column Chart
To create a Single Column Chart, follow these steps:
- In the data source, select the F9:V11 area.

- On the Jedox ribbon, select the Success Chart button.
- Choose the Deviation Column chart type and click Create. The chart is displayed.

- Select G5 for Message and G6 for Title in the Header section. You can also choose different font settings by clicking the button on the right.
- In the Footer section, type "Bikers Best AG".
- Configure the separator line as follows: Position: G17, Height: 30, Width: 3, Color: Gray
- In the Bar category, select the deviation pattern after separator to be displayed as diagonally striped.
- in Marker Line, set the start and end positions to 9 and 10, respectively.
- Click Update. The Deviation Column SUCCESS chart is displayed.


Updated January 28, 2025