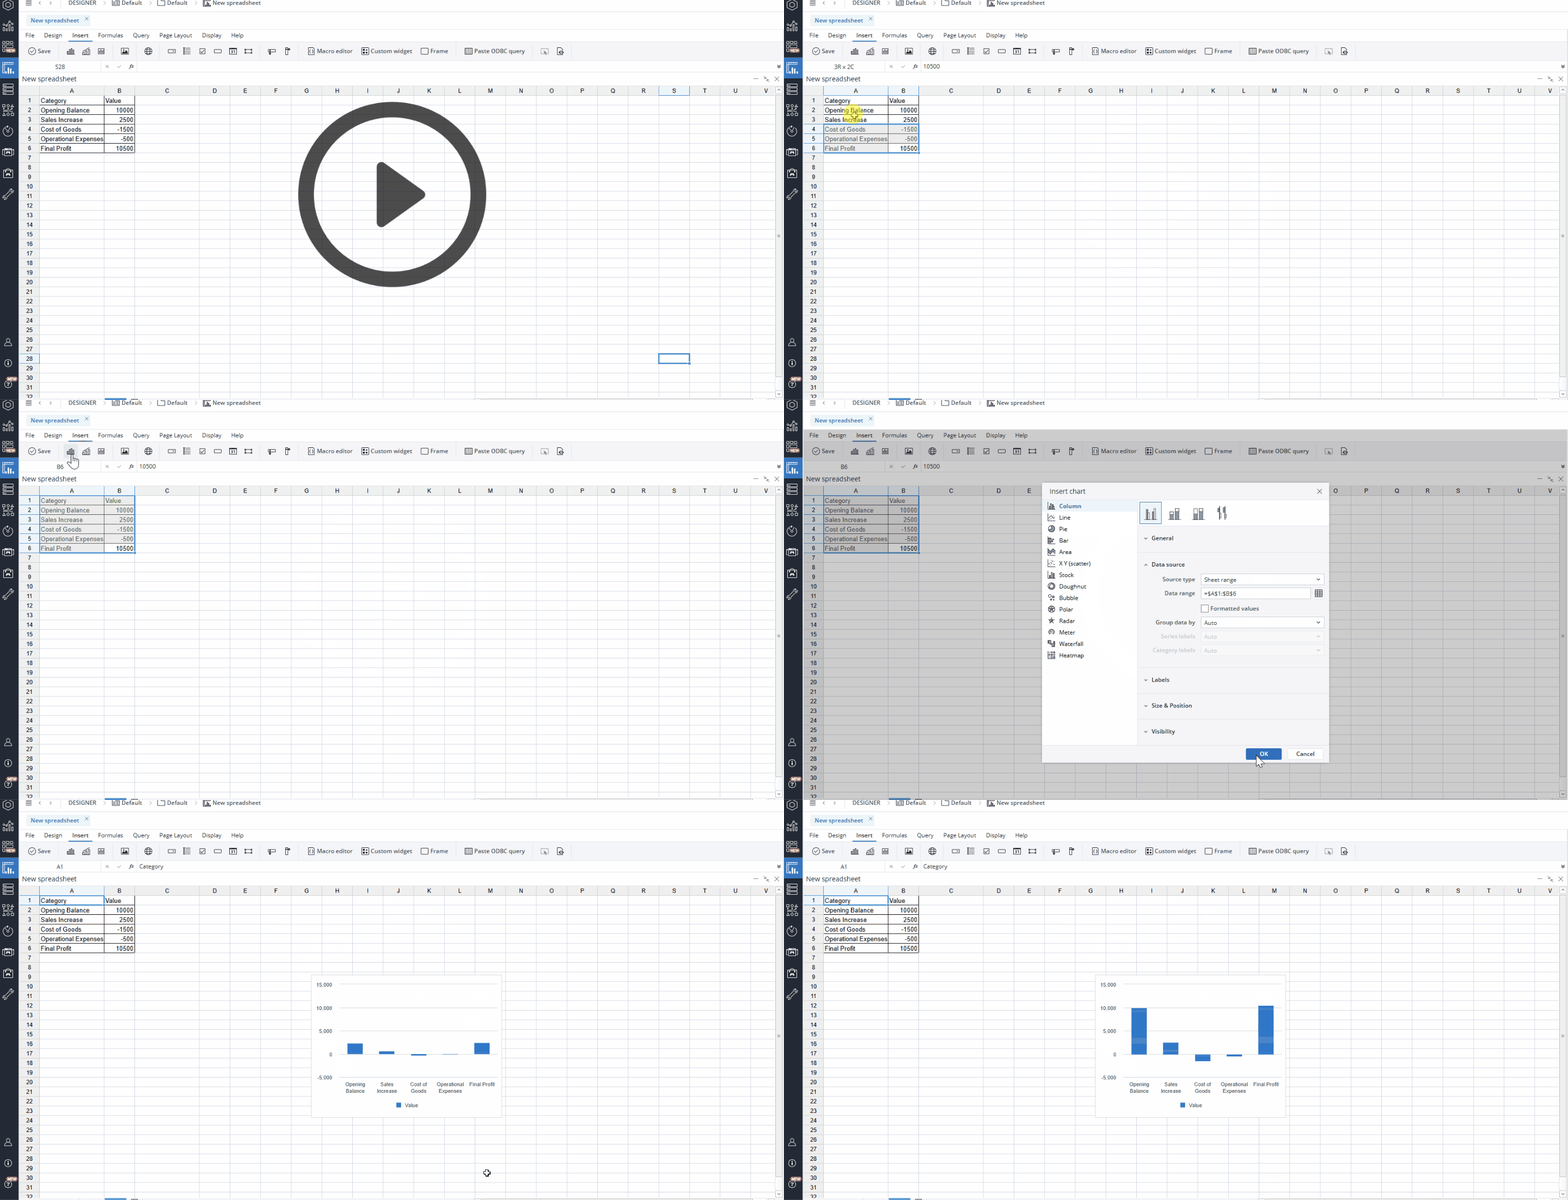
To create dynamic and visually appealing charts in Jedox Spreadsheets, begin by navigating to Insert > Chart in the toolbar. This will allow you to select and configure a chart type tailored to your data and analysis requirements.
For a deeper understanding of the various chart types and their practical applications, consider installing the Chart Samples Model from the Jedox Marketplace. This comprehensive resource provides an in-depth overview of each chart type, complete with detailed examples, implementation tips, and best practices. By exploring this model, you can gain valuable insights to confidently choose and optimize charts that best support your data visualization goals.
For most chart types, you can format axis and label numbers as percentages, creating a polished and consistent presentation. Tooltips also align with data label formatting, maintaining uniformity in data display. Additionally, when exporting charts as PDF or HTML files, dynamic charts are preserved.
Note: When exporting charts to PDF, HTML, or XLSX, all data series are exported, regardless of any visibility changes or series selections made in the browser Any series selection or visibility adjustments you make in the browser will not impact the final exported file.
Data sources
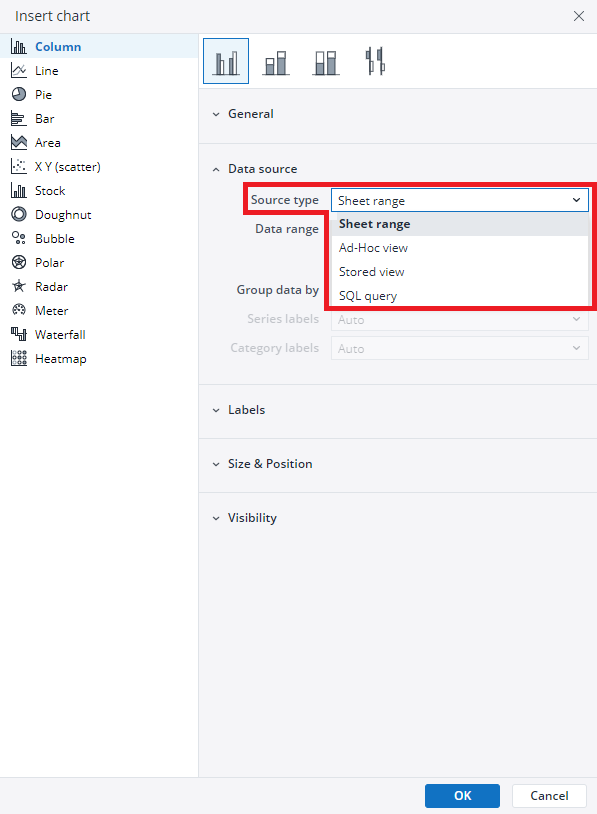
You can define data sources directly in the "Insert Chart" dialog. This allows you to select and configure the data that will be used to populate your chart, simplifying the setup process and ensuring your visualization reflects the desired information.
You can use the following data sources to create a chart:
|
Sheet range |
Use data directly from a named range. |
|
Ad hoc View |
Create a new Jedox ad hoc View as the data source. |
|
Stored View |
Choose an existing View—either a global stored View or a private stored View—as the chart's data source.
Note If you select a stored view (either global or private) as the data source for your chart, it cannot be exported in XLSX snapshot format. This limitation applies across all stored views, impacting export options. |
|
SQL Query |
Enter a SQL query connected to a database to retrieve and display data. |
Hint: When you are making charts from the Jedox Views, it is always recommended to use a Stored View or an Ad hoc View in the Source type of the chart. You can also use a Jedox function, PALO.VIEW.TABLE, to create a chart with a Jedox View that is already in a sheet.
Note that you can also select your data source directly in Jedox Spreadsheet and then go to Insert > Chart in the toolbar. This approach eliminates the need to manually add the data source.
Next Step: Formatting Charts
Updated July 3, 2025


