This example builds on the previous Subset example, Top-Ten Analysis. In this article, we will show two examples. In the first one, we display the products that have made 80% of the total turnover for the fourth quarter of 2014 ("A" elements). In the second example, we show the products that made only 10% of the total turnover for the 4th quarter of 2014 ("C" elements). The elements in the middle ("B" elements) can then be easily identified.
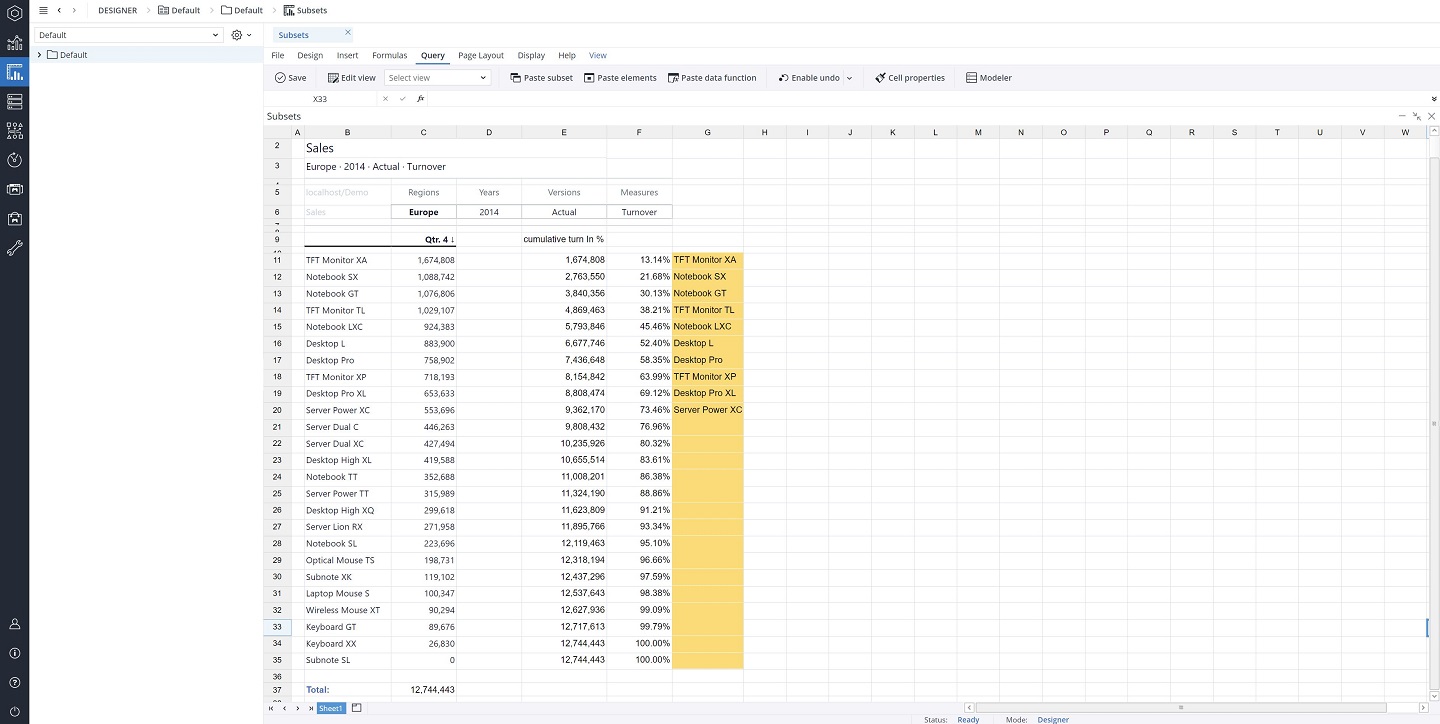
We use the result of the Top-Ten Analysis as starting point.
Example 1: "A" elements
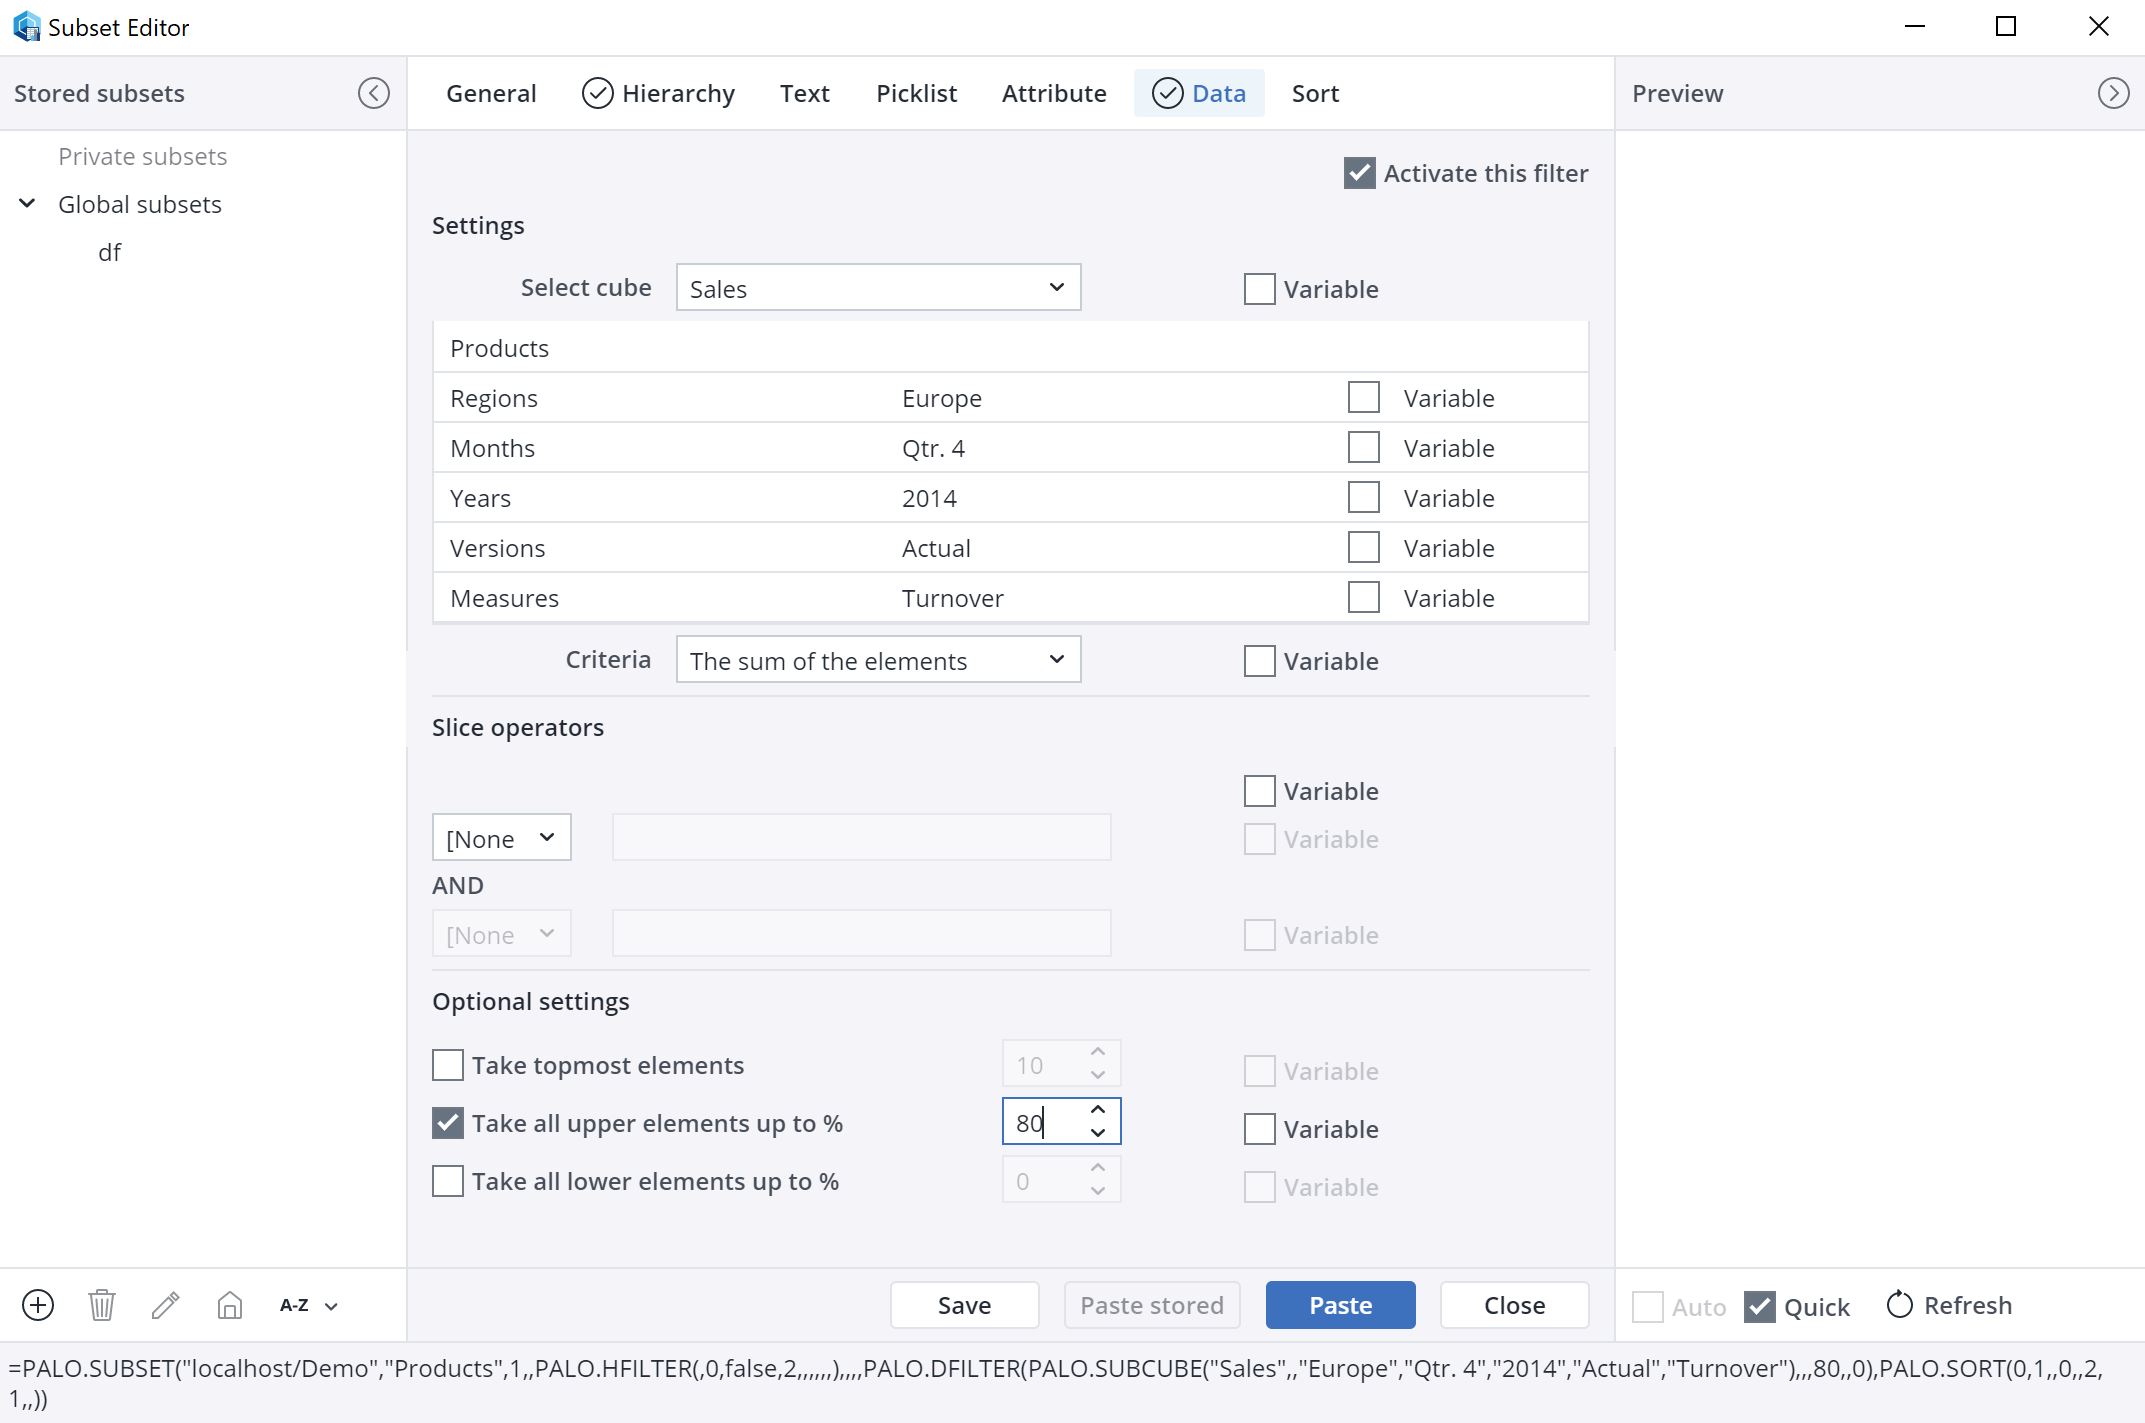
Mark cells G11:G35 and open Paste Subset. We retain the previous settings and change only the Data tab as follows:
- Disable: Take topmost elements: 10
- Enable: Take all upper elements up to %: 80
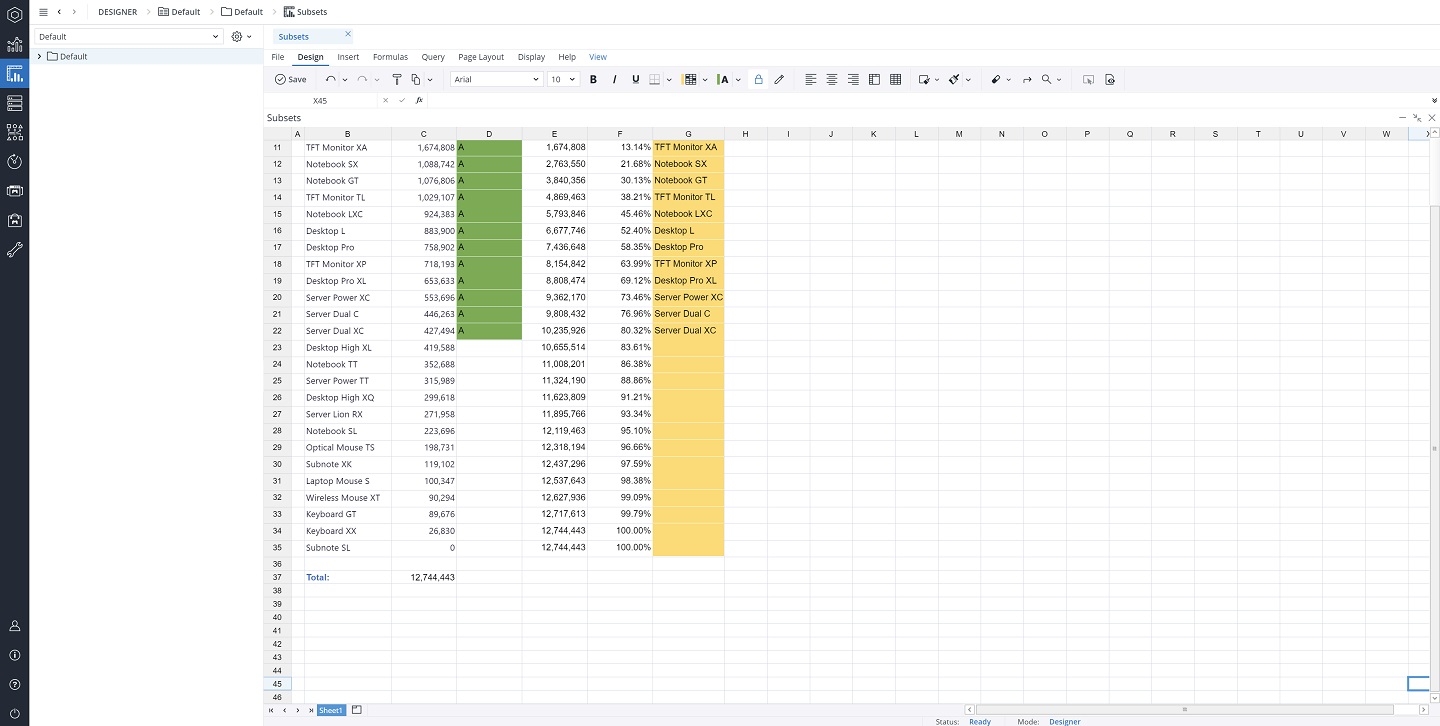
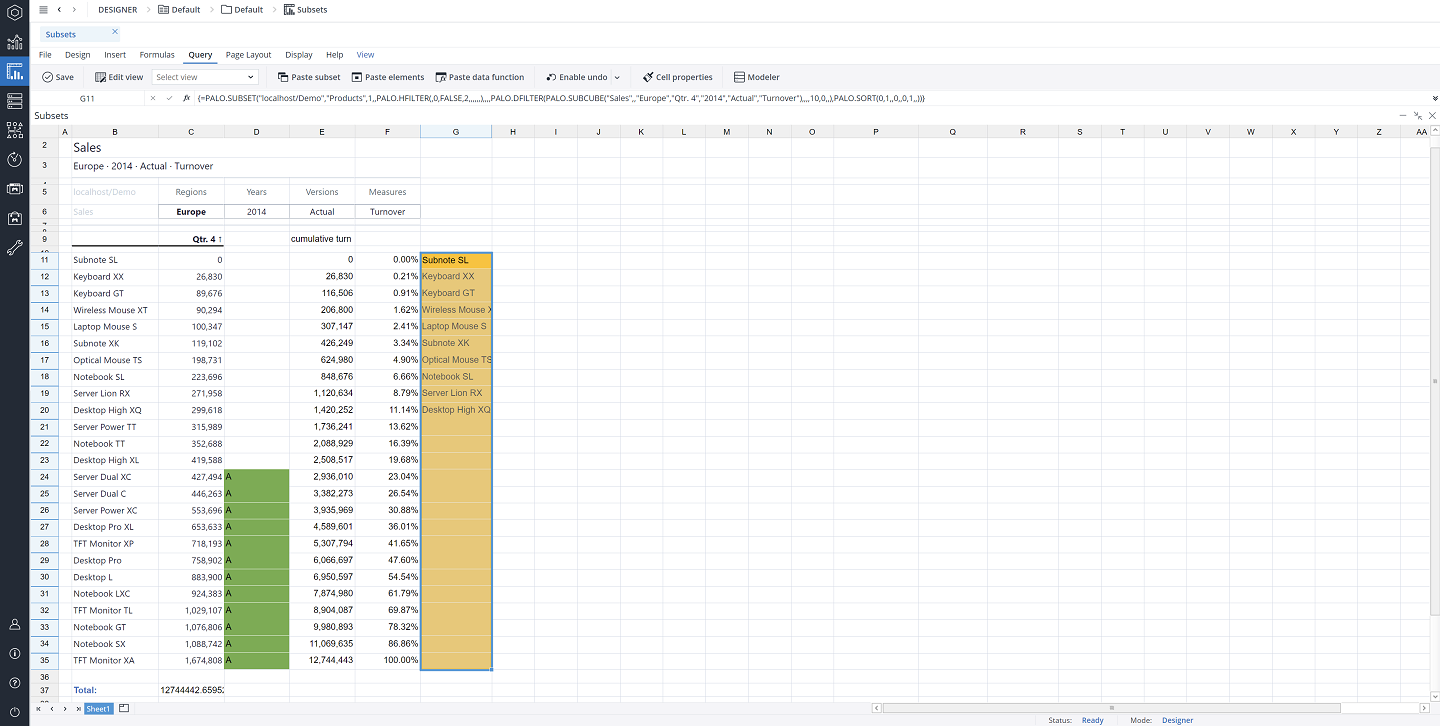
Click Paste for the following result:
The Subset shows the largest elements with over 80% turnover. To identify these elements, we enter "A" in column C.
Example 2: "B" and "C" elements
In the second example, we want to display the products that made only 10% of the total turnover for the 4th quarter of 2014.
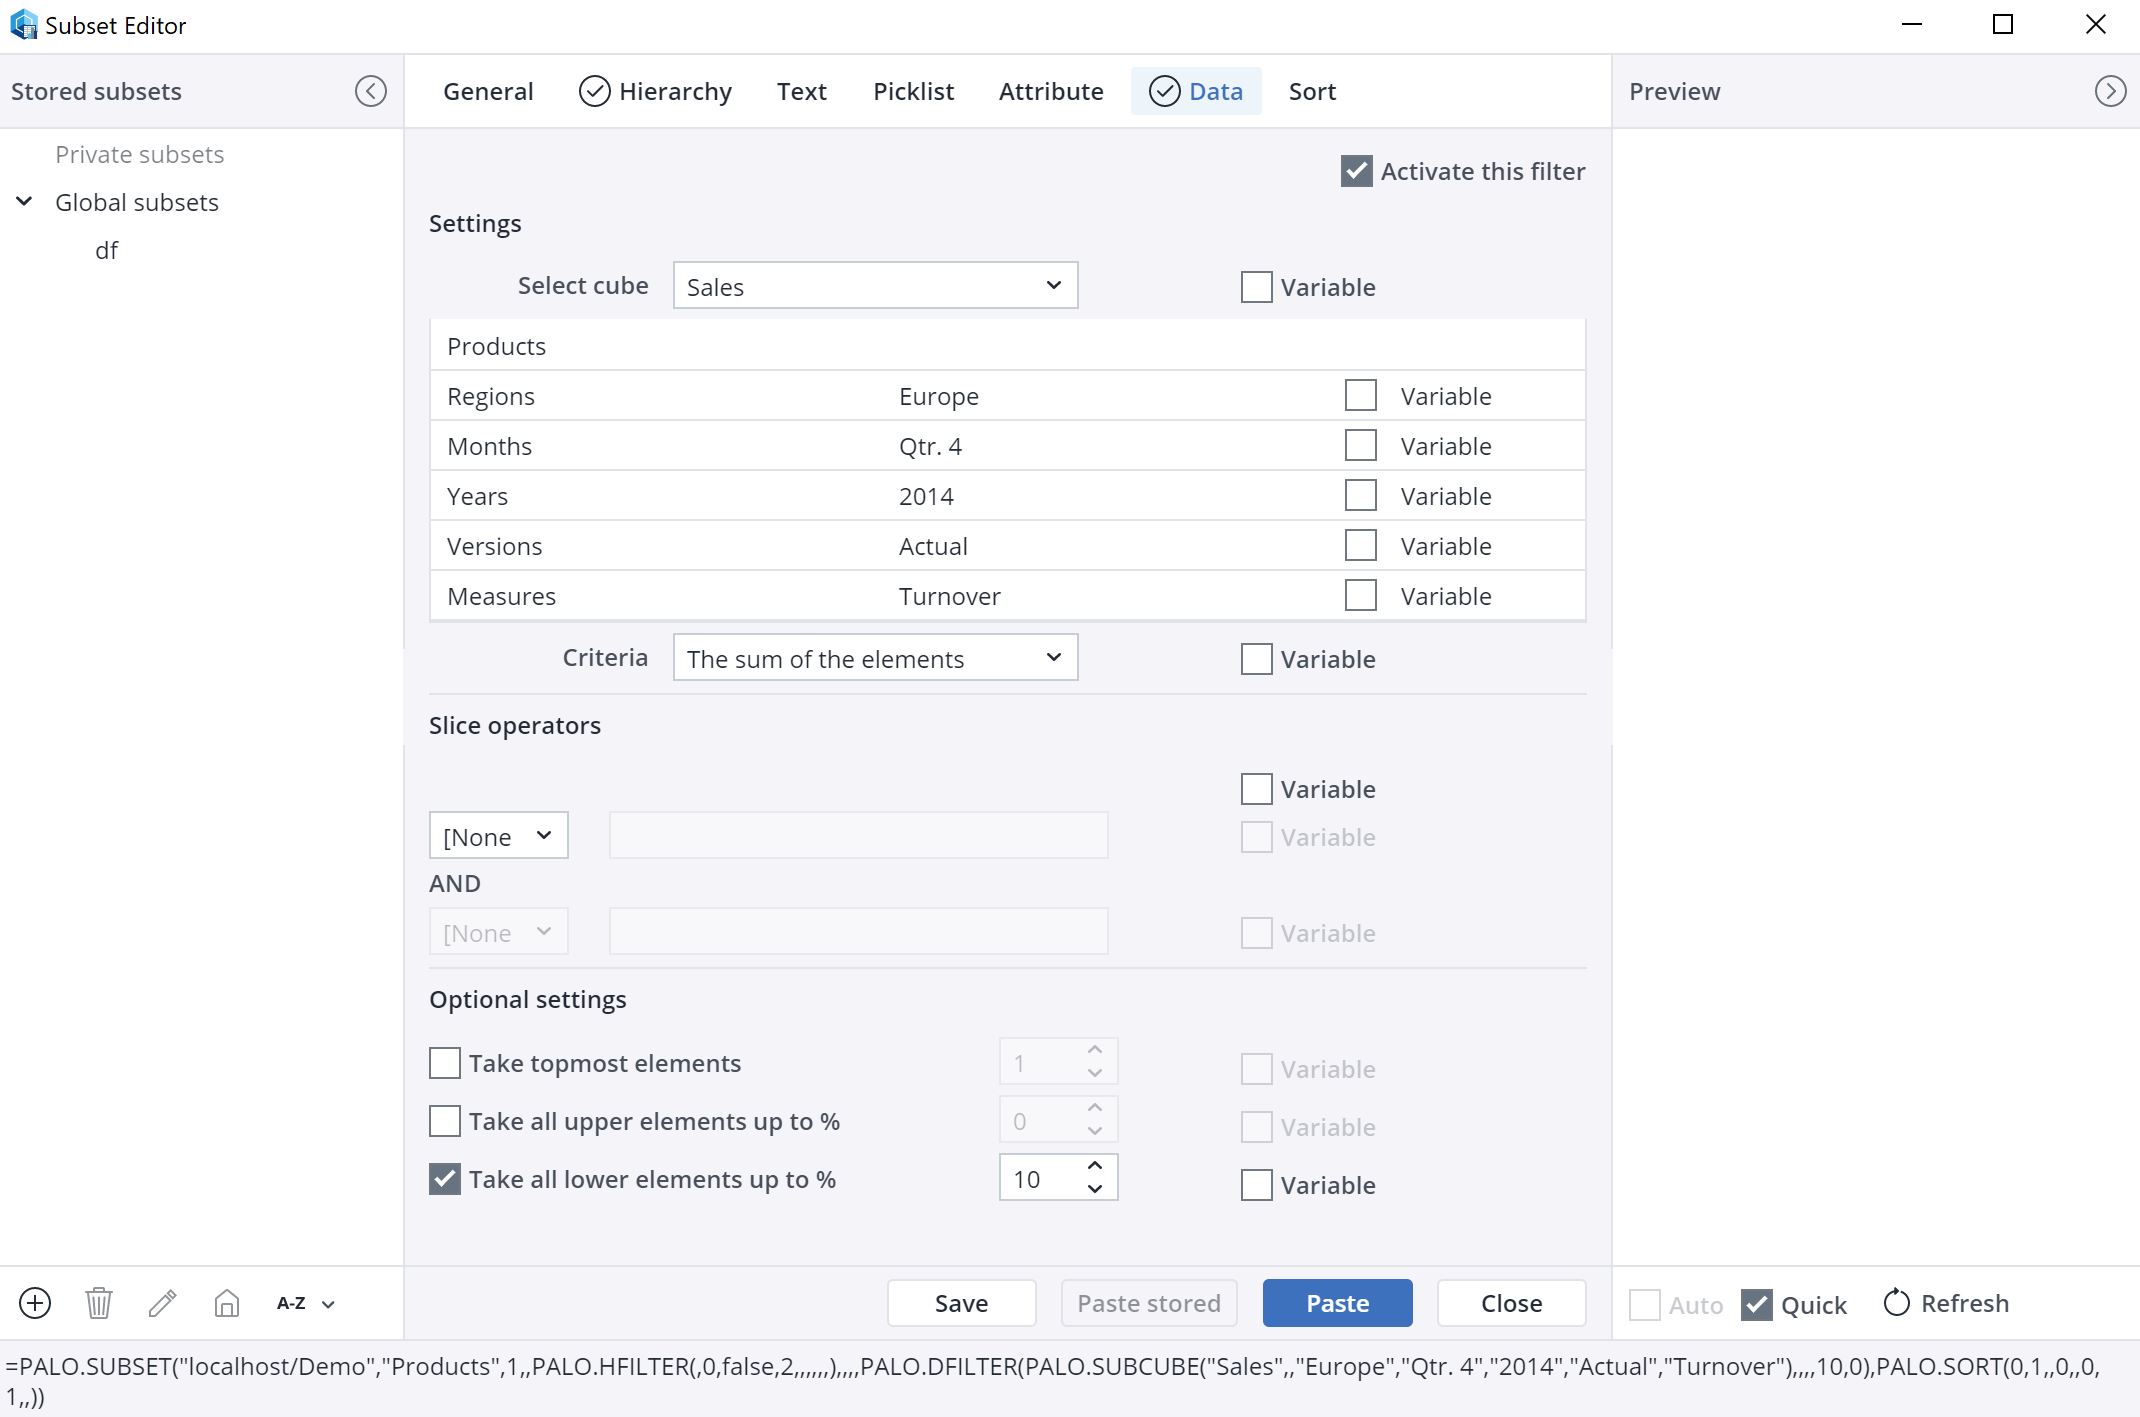
First, we change the order in B11: D35 to ascending. Then we mark G11:G35 and open Paste Subset. Make the following changes:
- Disable the option "Take all upper elements up to %: 80" in Data tab
- Enable the option "Take all lower elements up to %:" and set to 10 in Data tab
- Disable "Reverse" in Sort tab
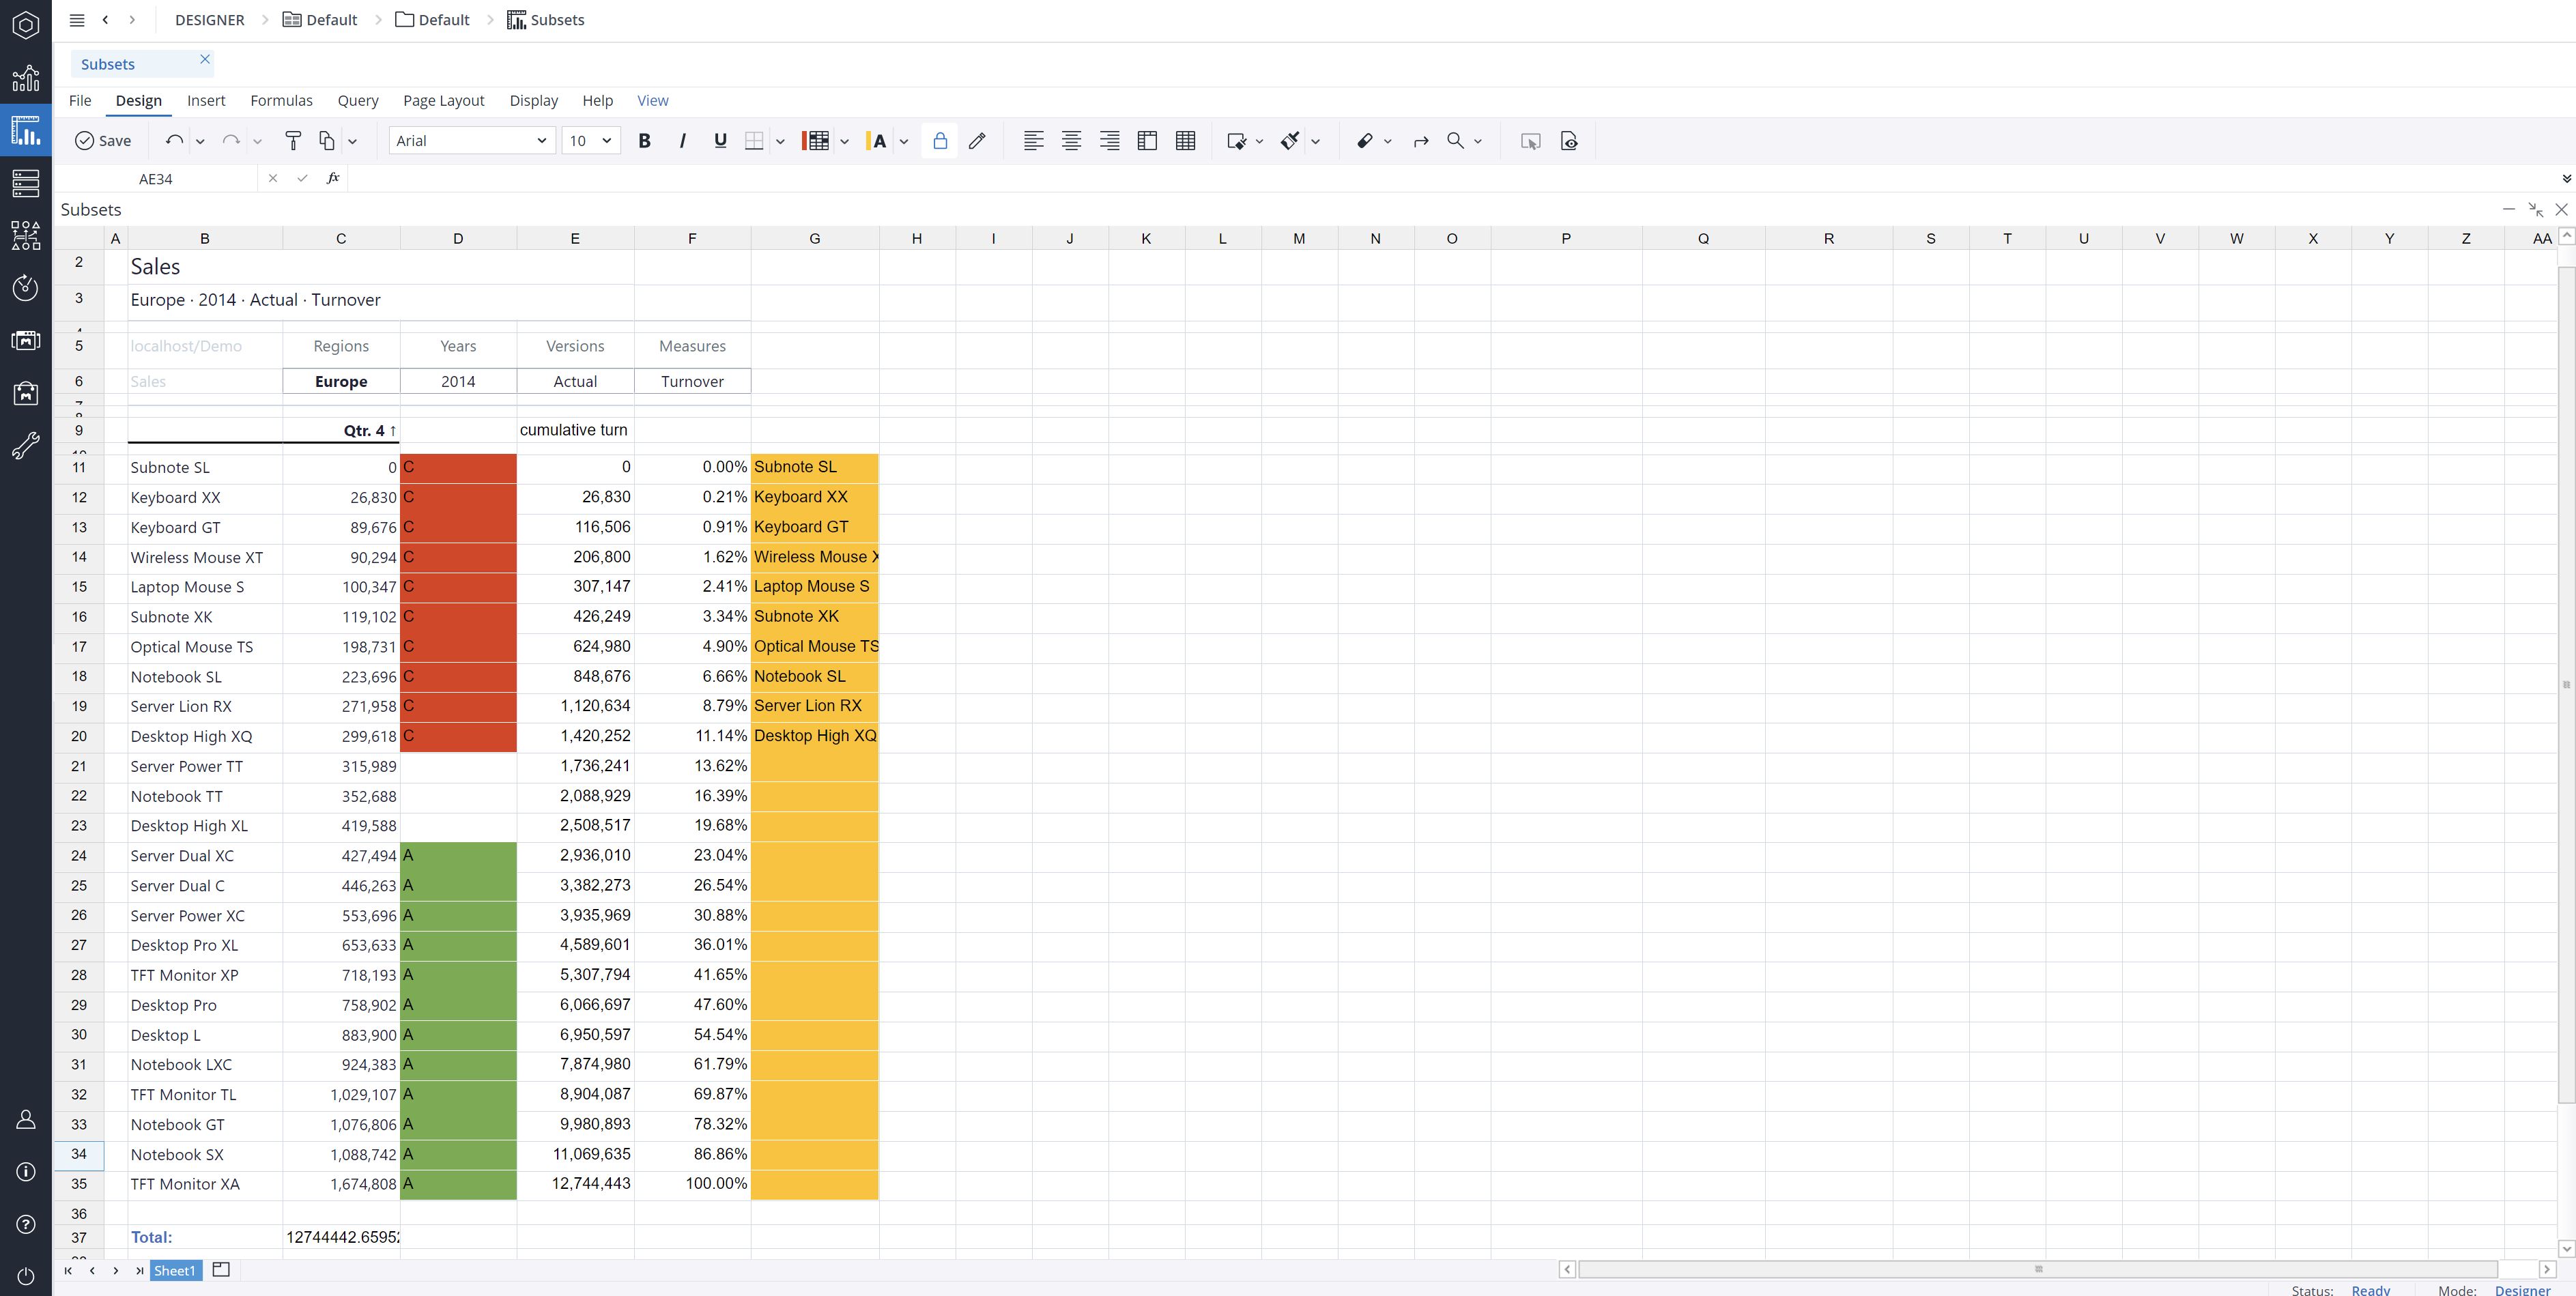
Then we get the following elements:
The Subset shows the elements with just over 10% turnover. To identify these elements, we enter "C" in column C.
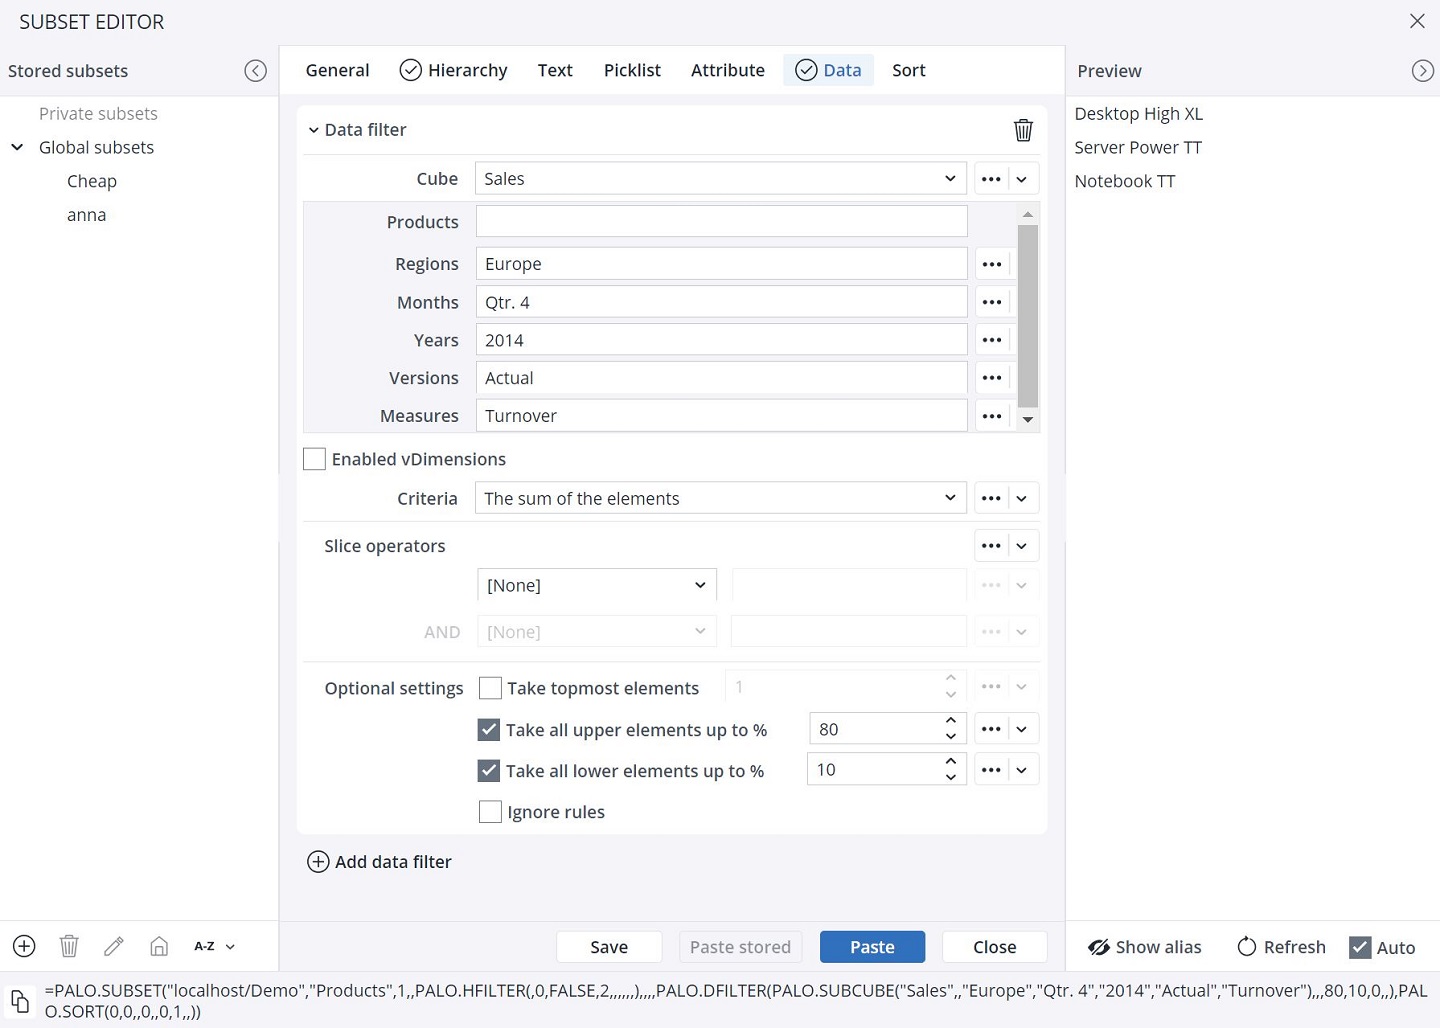
To obtain the elements that are between the bottom 10% turnover limit and the upper 80% limit, we have to enable both borders simultaneously in the Data tab:
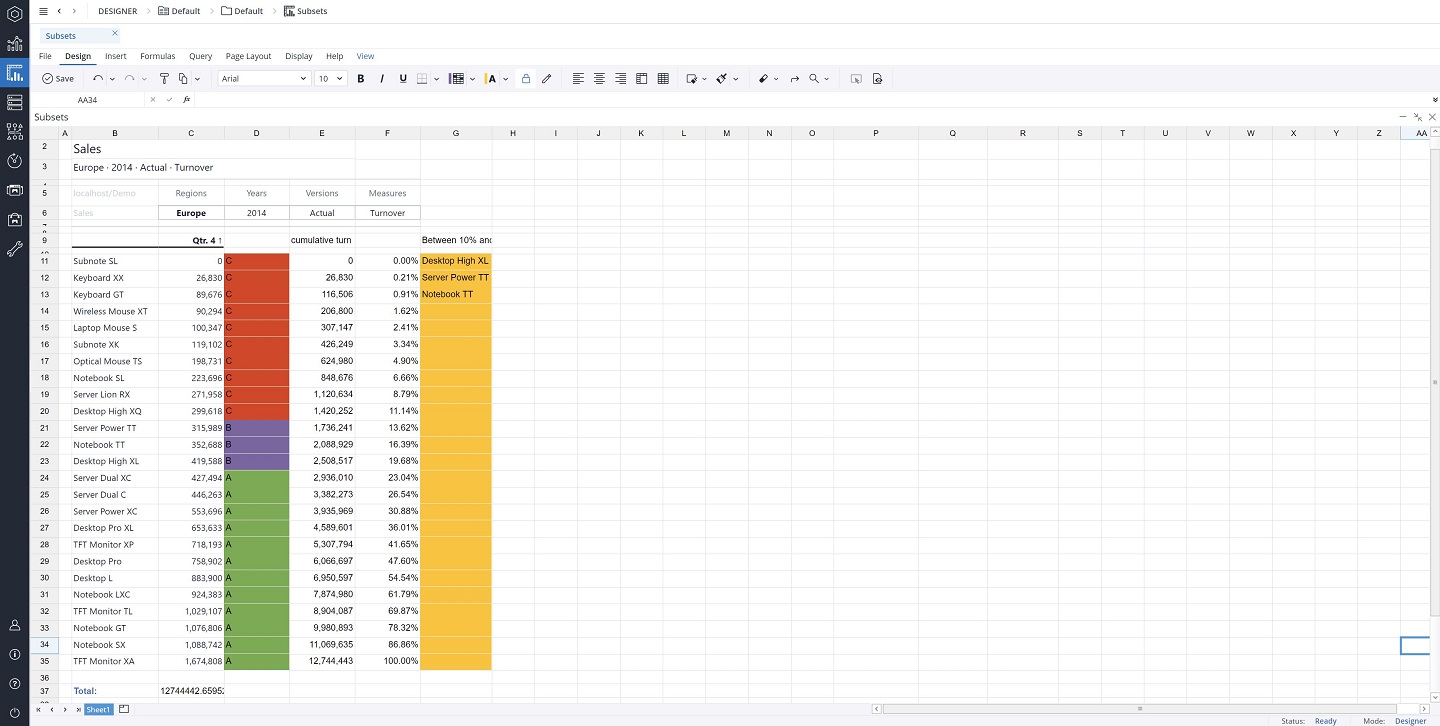
The Subset shows the remaining "B" elements. To identify these elements we enter "B" in column C.
Now the ABC-turnover analysis of the products is complete for the 4th quarter of 2014 for the region Europe.
Updated July 21, 2025
