The Canvas Dynatables feature empowers users to build real-time analytics swiftly and efficiently. With its intuitive interface and dynamic data capabilities, users can generate insightful reports and visualizations on the fly, streamlining the decision-making process and enhancing data-driven outcomes.
Adding Dynatables to the Canvas
When you drag and drop a Dynatable onto your Canvas, a dialog box appears, prompting you to select a Dynatable from your saved Dynatables or build a new one. After choosing the desired Dynatable, a preview is displayed. You can then adjust the Dynatable as needed before clicking Apply to confirm your changes.
After adding the new Dynatable to your Canvas, a visual cue (blue highlight) will indicate the newly created Dynatable.
Format tab
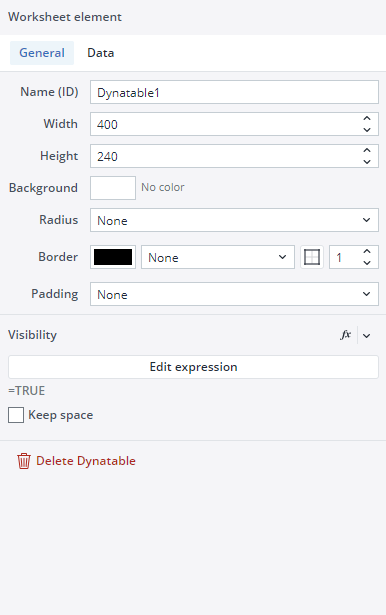
Once your Dynatable is applied to your Canvas, a dialog with two tabs opens on the right side of the screen. In the Format tab, you can configure properties such as padding, size, frame radius, border, and background color. The lower section of the Format tab enables you to delete the Dynatable. It is also possible to delete the Dynatable by right-clicking on it and selecting Delete.
Data tab
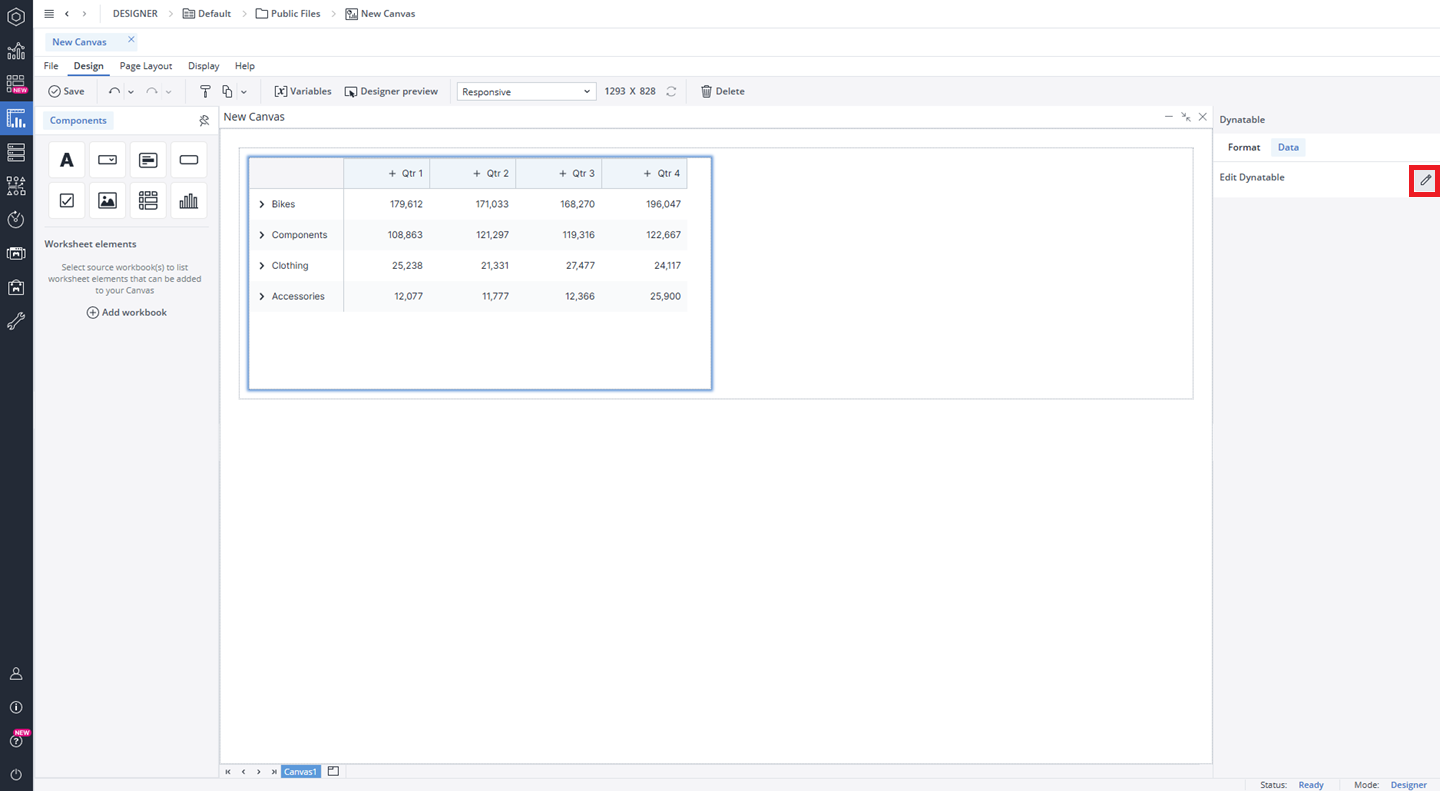
You can use the "Edit Dynatable" option in the Data tab to modify, rearrange, and customize your Dynatable to suit your needs. See the Modifying Dynatables article for more information.
Editing Dynatables
Once you have positioned your Dynatable onto your Canvas, you can still edit it in many ways. You can copy/cut and paste your Dynatable onto different frames and stacks, move it around by dragging and dropping it, and undo/redo your formatting and placement of your Dynatable. You can also edit your Dynatable or completely change it. To do this, once you have selected the Dynatable, click on the Data tab on the right side of the screen. Then, click on the Edit Dynatable option.
It is also possible to interact with the Dynatable using the native combobox feature. By connecting the @variables assigned to a combobox to the POV dimensions in the Dynatable, any changes made in the combobox selection will automatically reflect in the Dynatable, ensuring real-time synchronization.
Data Entry in Dynatables
The data entry functionality is also supported in Canvas native Dynatables, allowing users to input and update values directly within tables. See the Modifying Dynatables article for more information.
Named ranges as a source
As a Canvas Author, you can utilize named ranges (defined in a spreadsheet) as the data source for Dynatables in your Canvas. This allows you to create dynamic, reusable Dynatables that automatically adjust to changing data. You won't need to hardcode data source areas (Database/Cube) or repeatedly define the same queries.
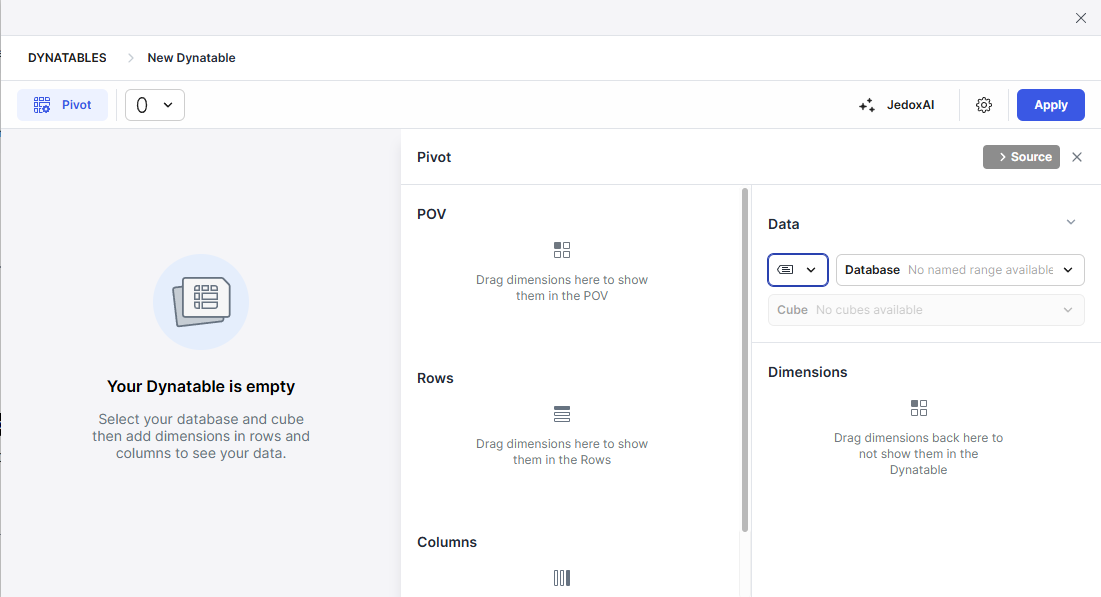
By default, the database selector is set to a static value. To change it to a named range, click on the Database parameters and select the "Named range" option.
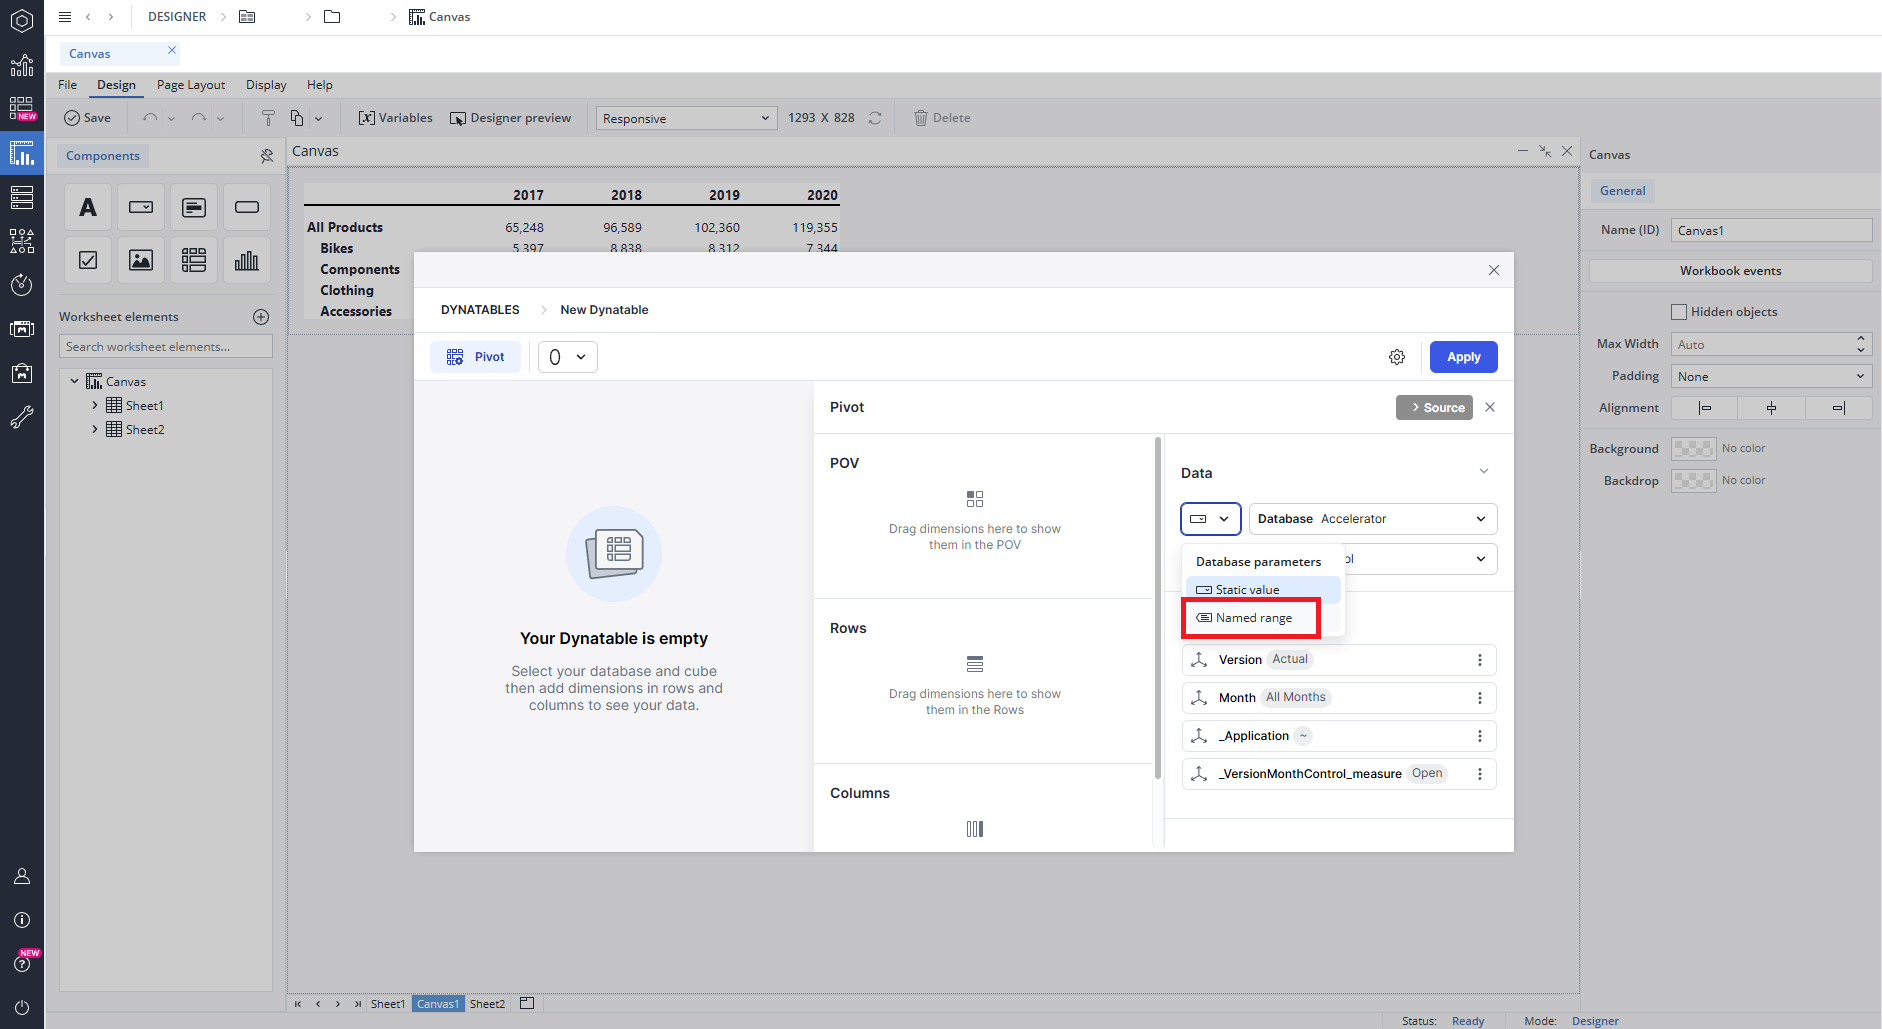
When you switch the parameter from a static value to a named range, the database preselection automatically sets to the first available named range if any are present. You can change to the named range you wish through the Database drop-down menu. Once you have selected your named range, cubes from the connected database will be accessible, and the dimensions will also be displayed, allowing you to start dragging dimensions to build a Dynatable.
However, if no named ranges are available, the database preselection will be removed, and you will see the message "No Named Range available." Additionally, the cube option will be disabled, displaying the message: "No cubes available."
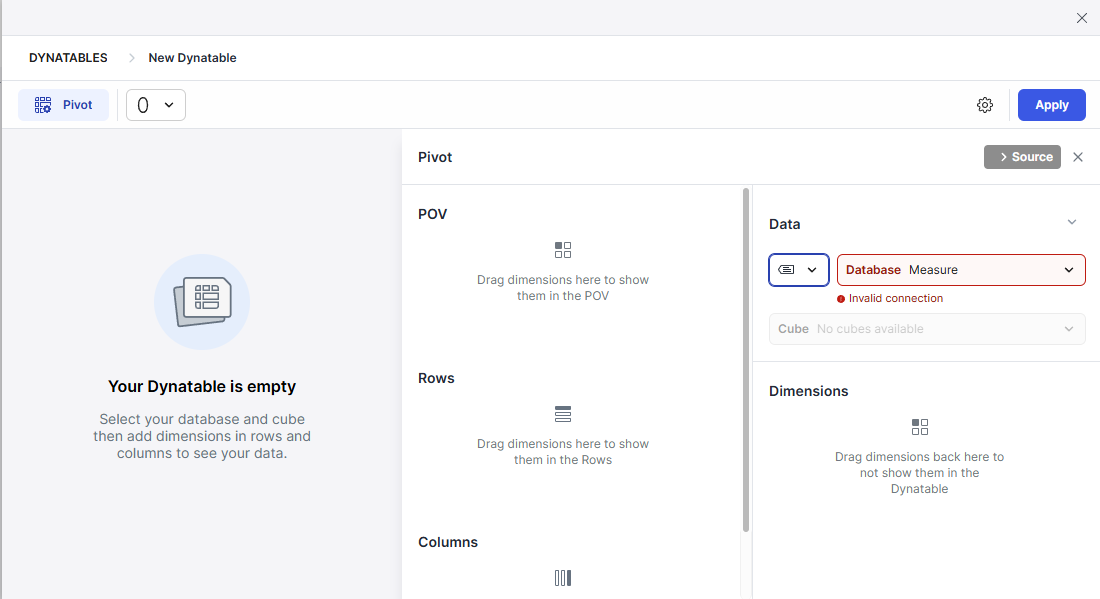
Furthermore, if you select a named range and the connection fails (for example, due to a spelling error, a change in the database name used in the named range, incorrect spelling of the named range, or its deletion), an error will appear in the cube selection field, accompanied by a message stating "Invalid connection."
Saving and deleting named ranges
When a Dynatable that uses a named range is saved as part of a Canvas, the name of the named range is also saved. If you rename the named range later, the connection will be lost, and the Dynatable will not display correctly.
If you delete the named range, the Dynatable will not load and you will see the “Invalid connection (data source lost)” error message.
Named ranges constraints and limitations
-
When using named ranges in Canvas Dynatables, the named range value must contain both the server and database name in the following format: Server/Database (for example, Localhost/Demo).
-
Named ranges only work when the named range references a worksheet cell value in WSS. Therefore, it is not possible to enter the value of the named range directly as text, whether in a WSS named range or a Canvas workbook event named range.
-
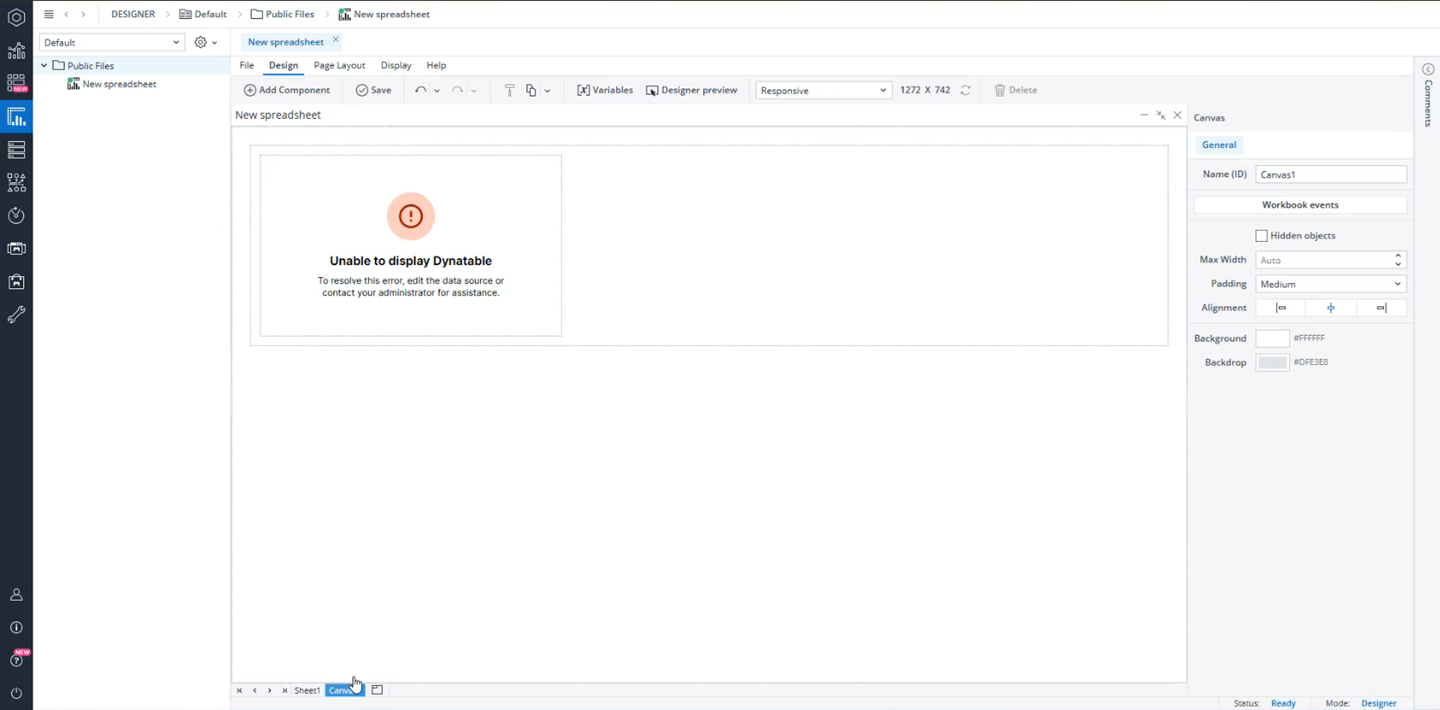
If a Dynatable on a Canvas uses a database connection from a named range, any updates made to the database name or the connection in that named range will not take effect immediately. These changes will only be reflected after approximately five minutes or after logging out and then back in. Until that time, the Dynatable will fail to load and will display the error message “Unable to display Dynatable.”
Stored Subsets as a source
You can use a stored subset as the source for a Dynatable dimension in Canvas. This makes it easy to apply both simple and complex element selections based on existing subset filters—such as Data, Attribute, or Picklist. By using stored subsets, you can quickly access relevant element groups without having to recreate filters manually each time.
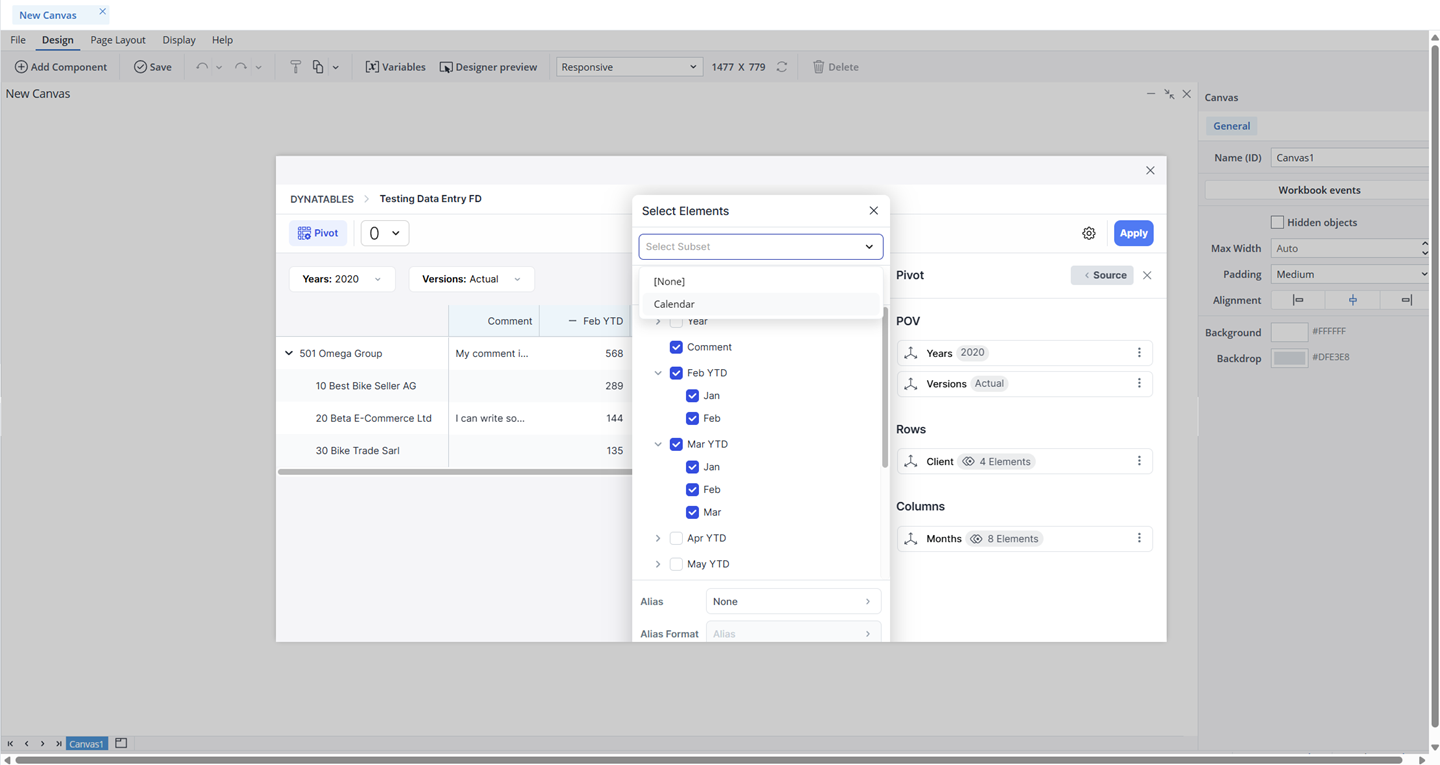
You can also refine the selection further by choosing only specific elements for the dimension that sources its elements from a stored subset. This helps ensure that the Dynatable displays only the elements most relevant to your analysis.
Note that stored subsets that rely on parameters (such as cell references, named ranges, or @variables) are not supported.
Right-click and Save
When working in Canvas, you can interact with Dynatables just like other components. You can right-click to copy, cut, paste, or delete a Dynatable, and when you save your Canvas, any changes you’ve made to the Dynatable component (create, edit, delete) are saved along with it.
Dynatables size limits (Min/Max)
The Dynatables in Canvas have defined minimum and maximum dimensions, and entering values outside these limits will not resize the Dynatable. The table below provides detailed information on these height and width limits.
| Component | Minimum width | Maximum width | Minimum height | Maximum height |
| Dynatable | 8 px | 1600 px | 8 px | 1200 px |
Note that the cross drill-down option is not available for Dynatables that use @variables in Canvas.
Updated May 6, 2026