![]()
Features in JedoxAI
Here you can read more about the main features in JedoxAI. Check also JedoxAI FAQ.
Start page
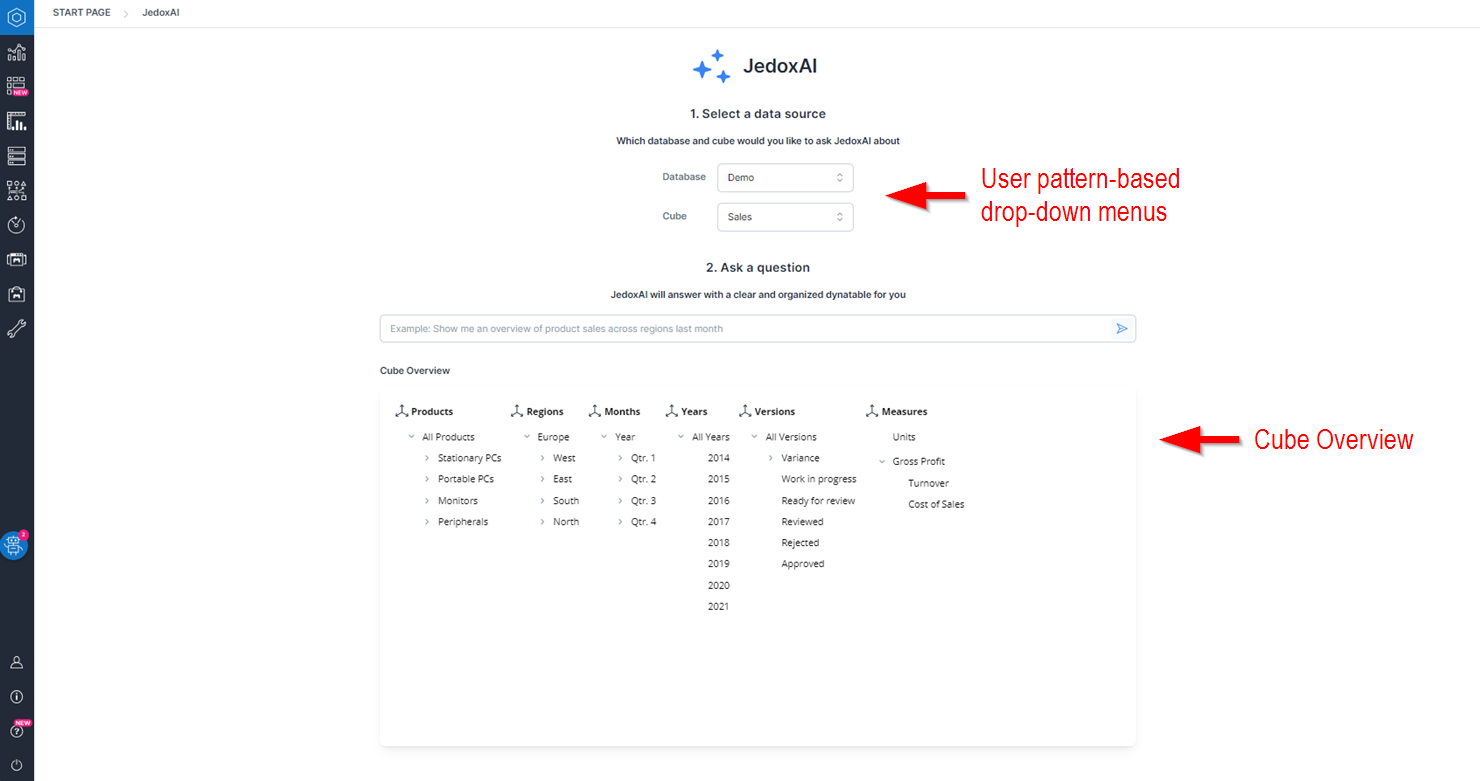
User pattern-based drop-down menus
The first step for using JedoxAI is informing the database and cube you'd like to pull data from. That's why the start page brings at the very top two drop-down menus for your selection. JedoxAI is able to identify usage patterns, so that over time the menus will give precise recommendations of the databases and cubes you most often consult and run queries about.
Cube Overview dialogue
To use JedoxAI, you first need to select the database and cube you want to work with. However, it is not always easy to build a query just relying on memory. In this regard, the Cube Overview feature is of great use. Displayed just below the search bar, this dialogue shows all dimensions and elements of the selected cube, so that you can consult its whole structure in a very short time. Knowing exactly what you wish to see at the Dynatable enables you to formulate a more precise and effective request.
Furthermore, by clicking on the desired elements in the Cube Overview dialogue you automatically complete the query being typed in the search field, which promotes a fast and dynamic search process.
Side panel
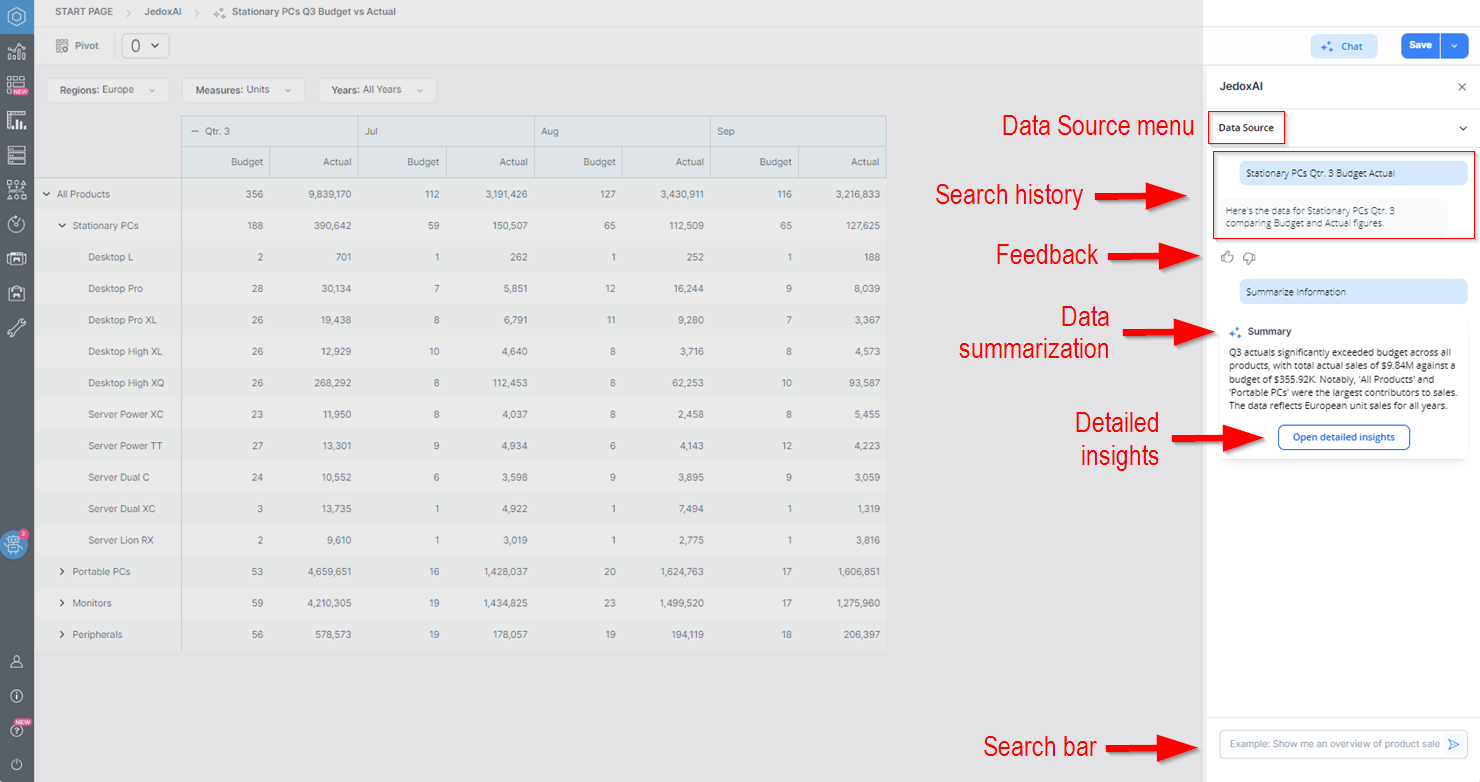
Once you run a query, the Dynatable is displayed on the main panel, while JedoxAI is shifted to the side panel for further consultation and new requests.
Data Source menu
At the very top of the side panel there is the Data Source menu, which can be expanded to display the drop-down menus with the database and cube currently in use, also allowing you to change them as needed.
Search history
Right below the Data Source drop-down menu, the side panel shows a history of every request made in the current session and the respective response. Submitted requests appear in blue and can be rerun by clicking on the regenerate button ( ) on the left side of each item. JedoxAI's responses appear in gray.
Feedback: improving the model
The feedback section is an opportunity for you to comment on the quality and value of the information provided.
Feedback is an integral part of the model's learning and improvement process, leading ultimately to more accurate answers.
Choose between the thumbs-up and thumbs-down icons to tell if the results were helpful or not. If not, please point out whether the information was not true, not Jedox-related, or other. An open field is also available for additional and more elaborate feedback.
When done, click Submit.
"Summarize Information" button: data summarization
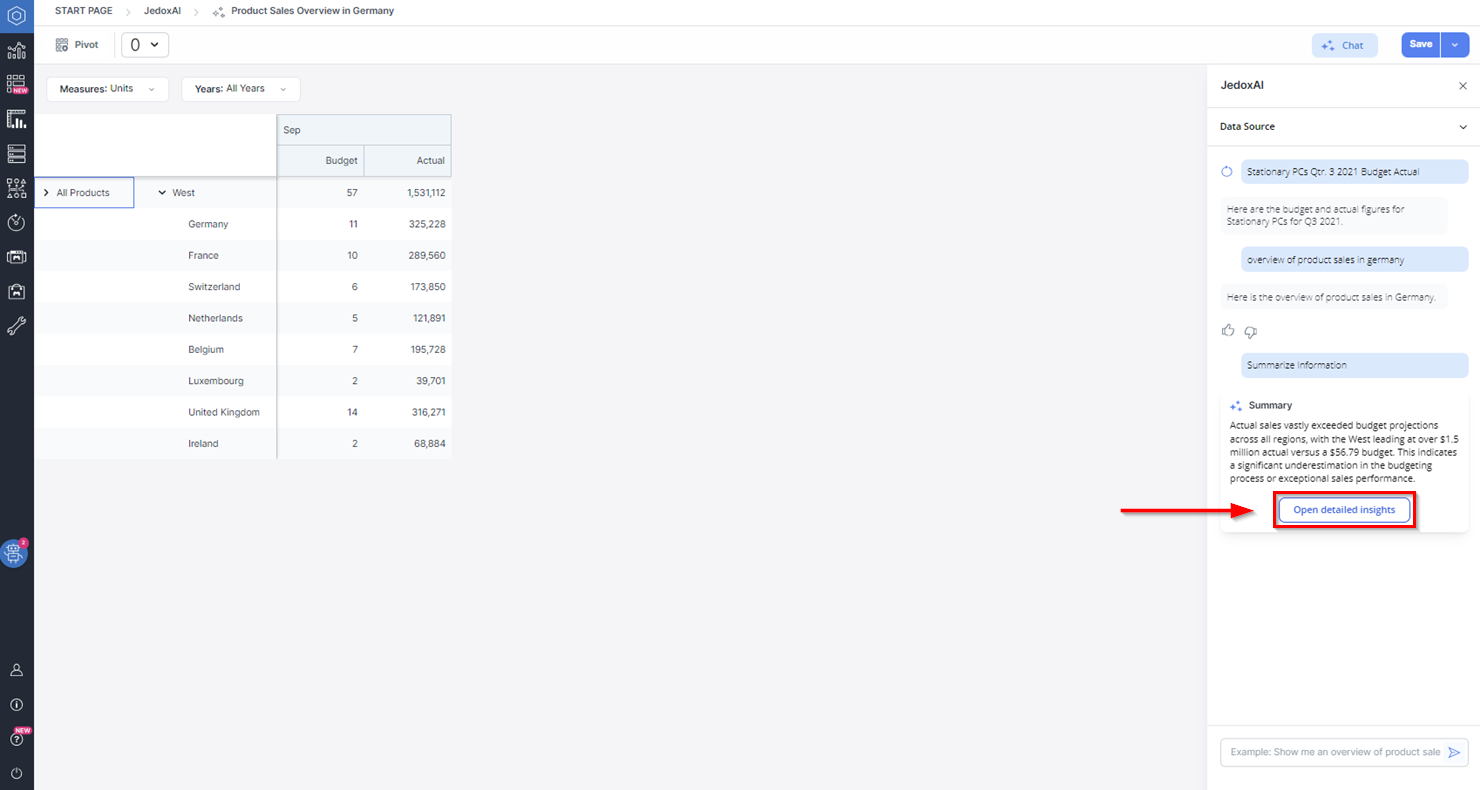
At the end of the search history you find the Summarize Information button. This provides you with a summarized analysis of the Dynatable resulting from your query, which can be very useful for a report introduction, for example.
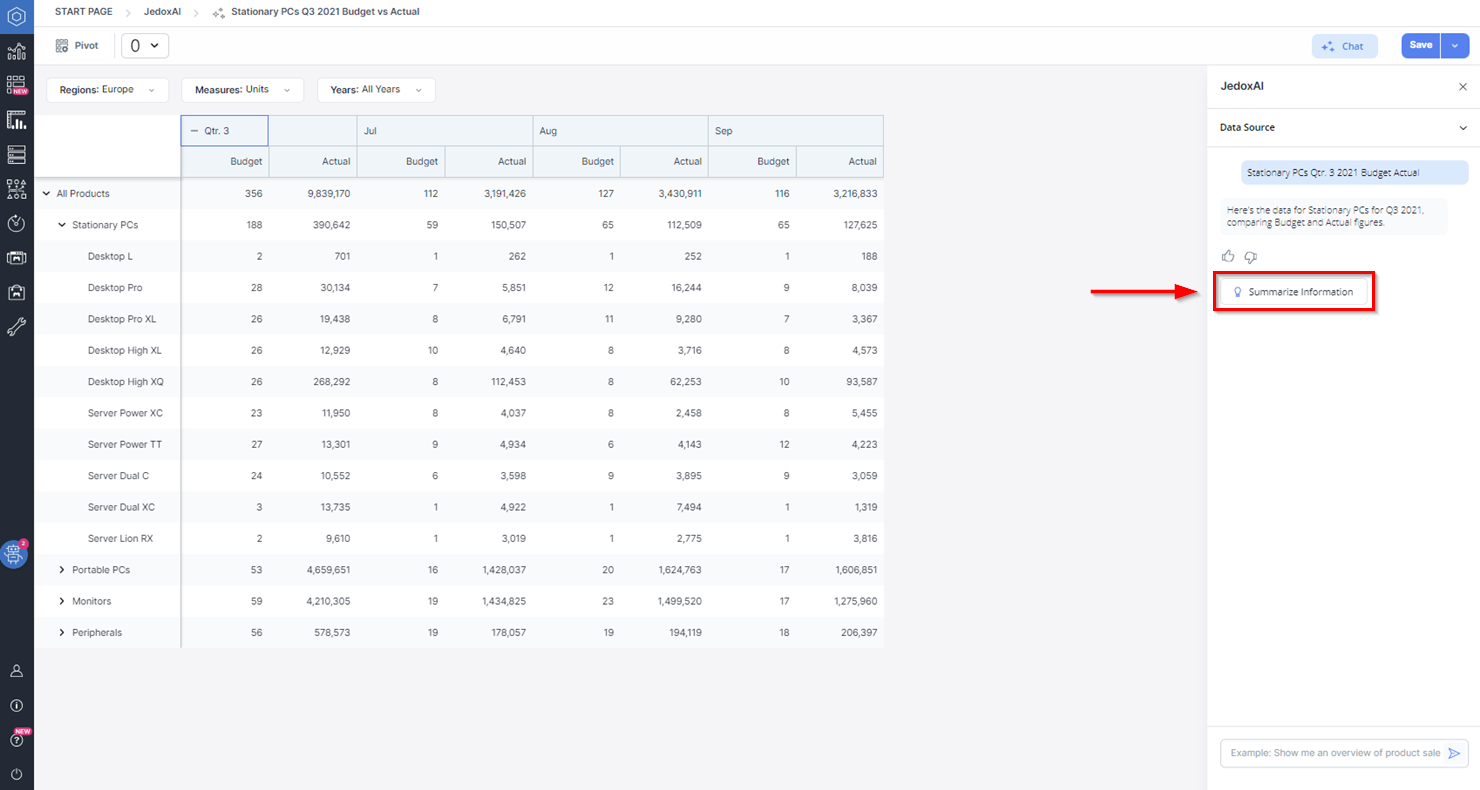
When you click on this button, a small "Summary" box appears in the search history with an eloquent analytical text ready for use.
Let's say you requested JedoxAI to compare budget and actual figures for stationary PCs in the third quarter of 2021. With the summarization feature, JedoxAI will deliver you a text stating that actual sales vastly exceeded budgeted figures, besides providing other relevant fragments of information. See the example below:
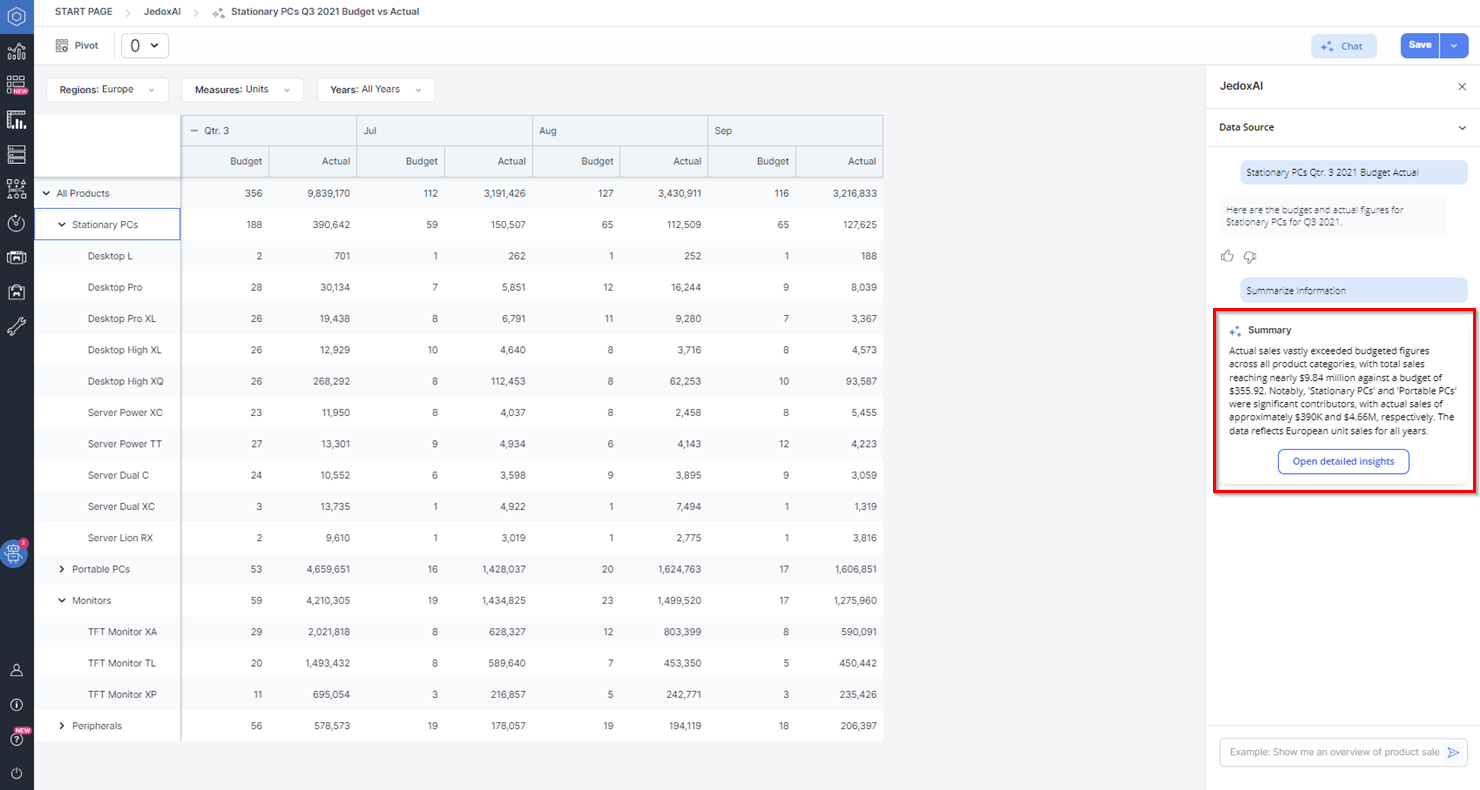
Detailed insights (through "Summarize Information" button)
This feature is embedded in the "Summary" box (see above) and fits perfectly those interested in a deeper analysis of the results, besides taking the production of reports to another level, with more comprehensive and meaningful information.
To access it, click on the Open detailed insights button inside the "Summary" box:
This action generates a full report presenting JedoxAI's detailed summary, analysis, and insights drawn from the query of your data.
The report is divided into four categories:
-
Data Overview: a sorted review of the main data from your search, such as timeframe, measure, and products.
-
Expert-Level Insights: a precise and sharp analysis of the results, scrutinizing attributes such as budgeting accuracy, market dynamics, and performance variation.
-
Key Insights: points out the main outcomes, such as overall performance, potential trends, and product specific performance.
-
Suggested Actions: recommended next steps after the analysis of the data, with attributes like budget review, inventory management, market analysis, and product development.
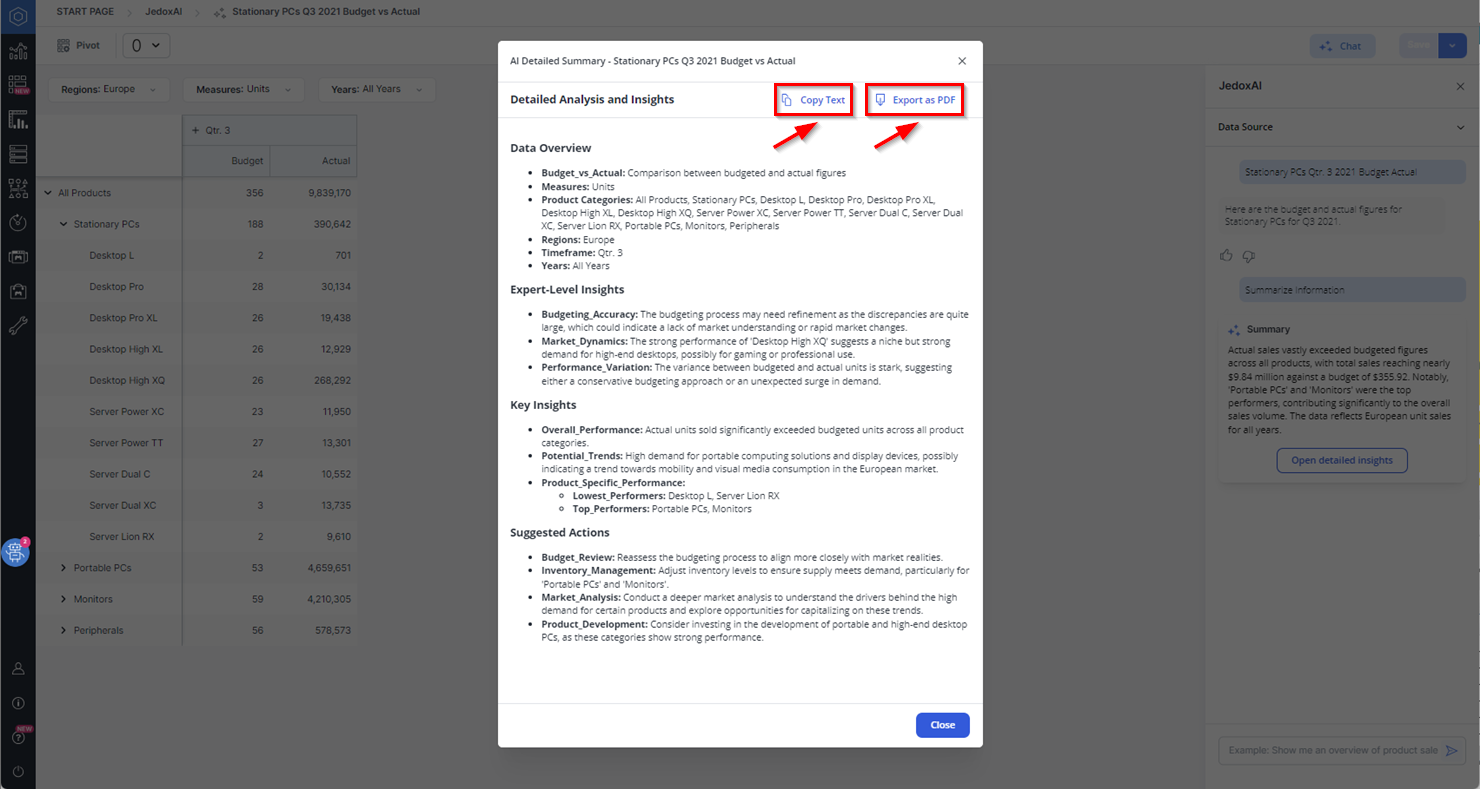
To close the report, click on the Close button at the bottom right of the dialogue.
Search bar
The search bar remains constantly available for new queries on the side panel.
Closing / reaccessing JedoxAI on the side panel
To close JedoxAI and have an expanded view of the Dynatable, click on the "X" at the top right of the side panel or on the Chat button above it. You can access JedoxAI at any time by clicking on the Chat button again. Your search history will not be lost by closing the side panel.
Dynatable
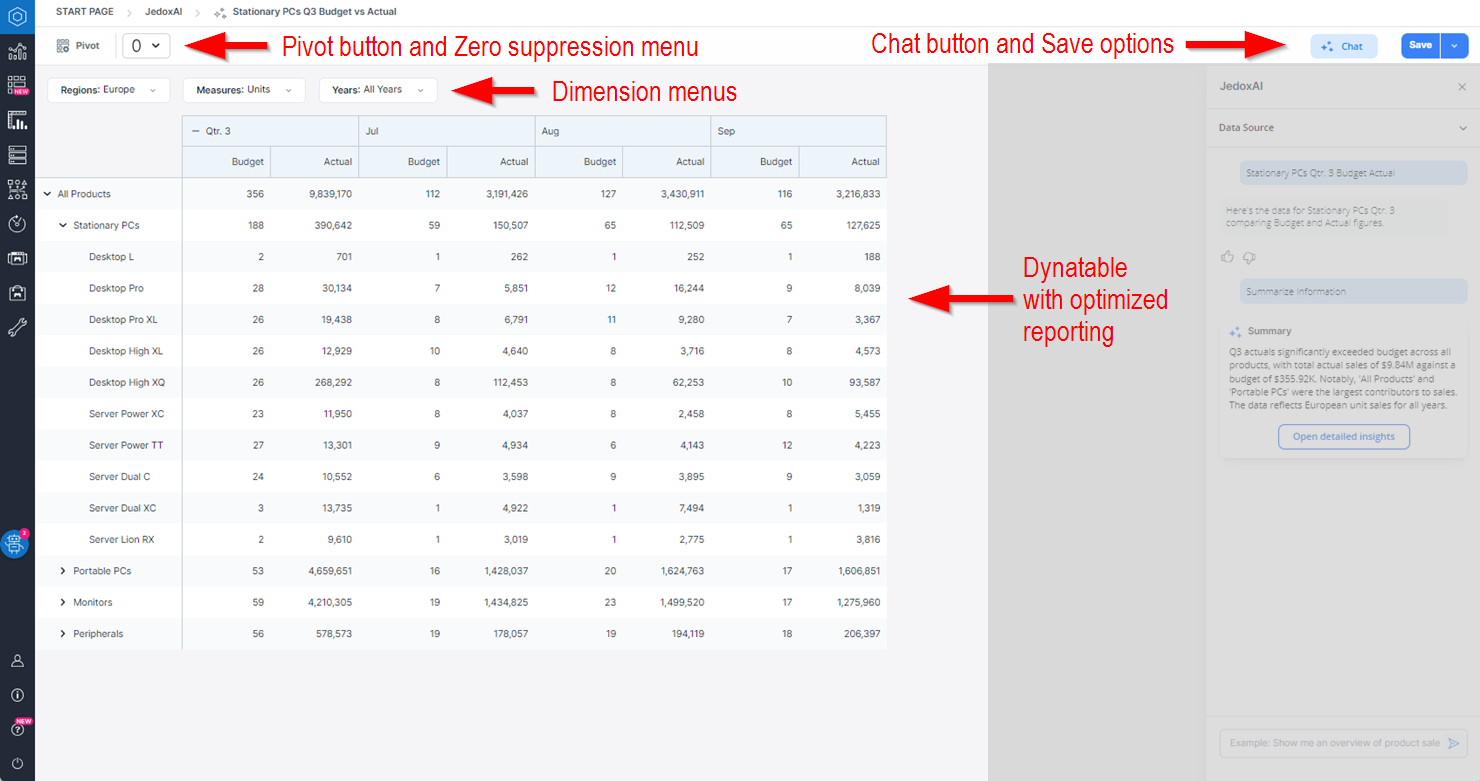
Enhanced and optimized reporting
The Dynatable resulting from your query displays expandable rows and columns in alternating colors, which improves readability and makes it easier for you to scan the data, especially when it comes to large datasets.
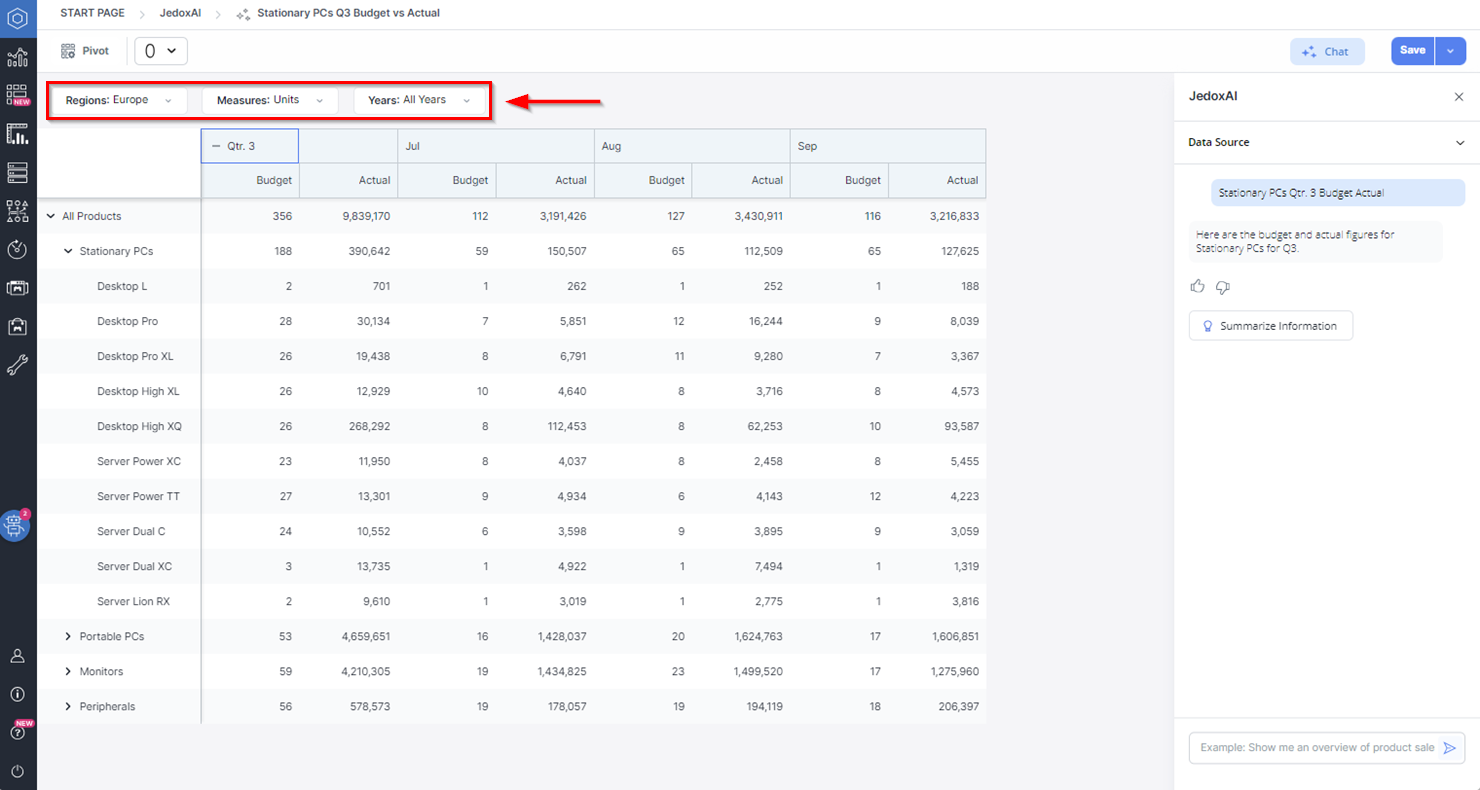
Dimension menus
Use the drop-down menus on the top part of the Dynatable to change the dimension elements selected for the search, therefore getting new insights without having to run another query.
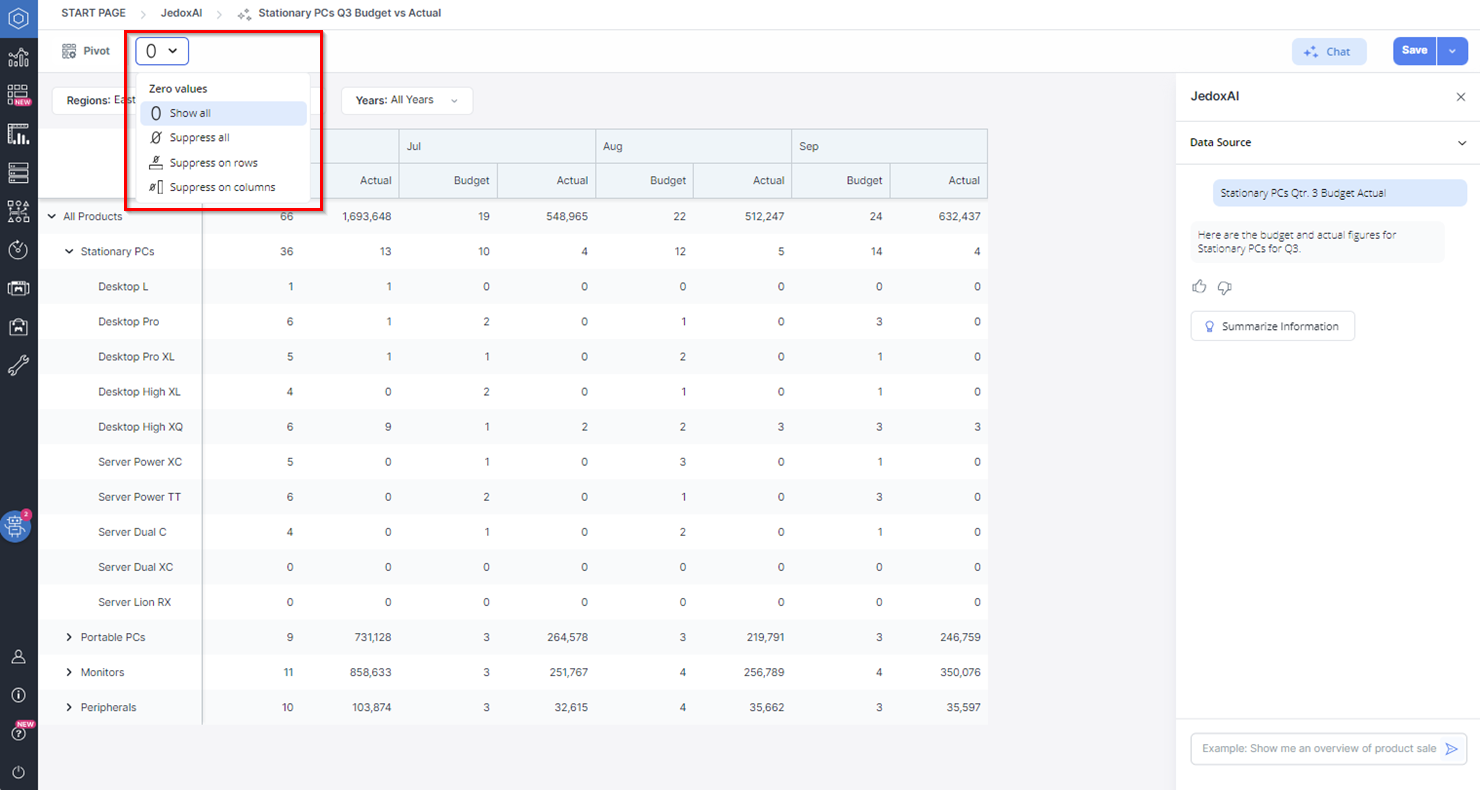
Zero suppression
The zero suppression menu on the top of the screen gives you the options of showing all zeros, suppressing all zeros, suppressing zeros on rows, or suppressing zeros on columns. Just click on the menu to see all the options and select one of them.
Pivot panel
To alter the presentation of your Dynatable, you can use the Pivot button on the top left corner of the screen.
By clicking on it, the Pivot panel opens on the right. Click on the Source button on the top right of the panel to expand it with a Dimensions tab, to where you can drag dimensions from the POV, Rows, or Columns in order to remove them from the Dynatable.
Use the menu button ( ) on the right of each item or simply drag and drop Dimensions across the Point of View (POV), Rows, and Columns sections to make changes in the Dynatable. The menu button also allows you to remove dimensions or select elements.
When you choose to select elements from the menu button, a dialogue with all the dimension's elements opens. It is also possible to access this dialogue by double clicking on a Dimension item. There you can search, include or remove elements from the Dynatable, as well as select aliases and alias formats. When finished, click Apply. The selected elements are visualized as tags within the Pivot interface.
This video illustrates how to use the Pivot panel:
Saving options
On the top right corner of the screen you find the Save button for your Dynatable. Click on the drop-down arrow to use the Save as option. A dialogue opens, where you must inform the name under which the Dynatable should be saved, an optional description of it, and its visibility, that is, either global or private.
The Dynatable will be available for you in the Jedox's Dynatable component.
Updated July 21, 2025