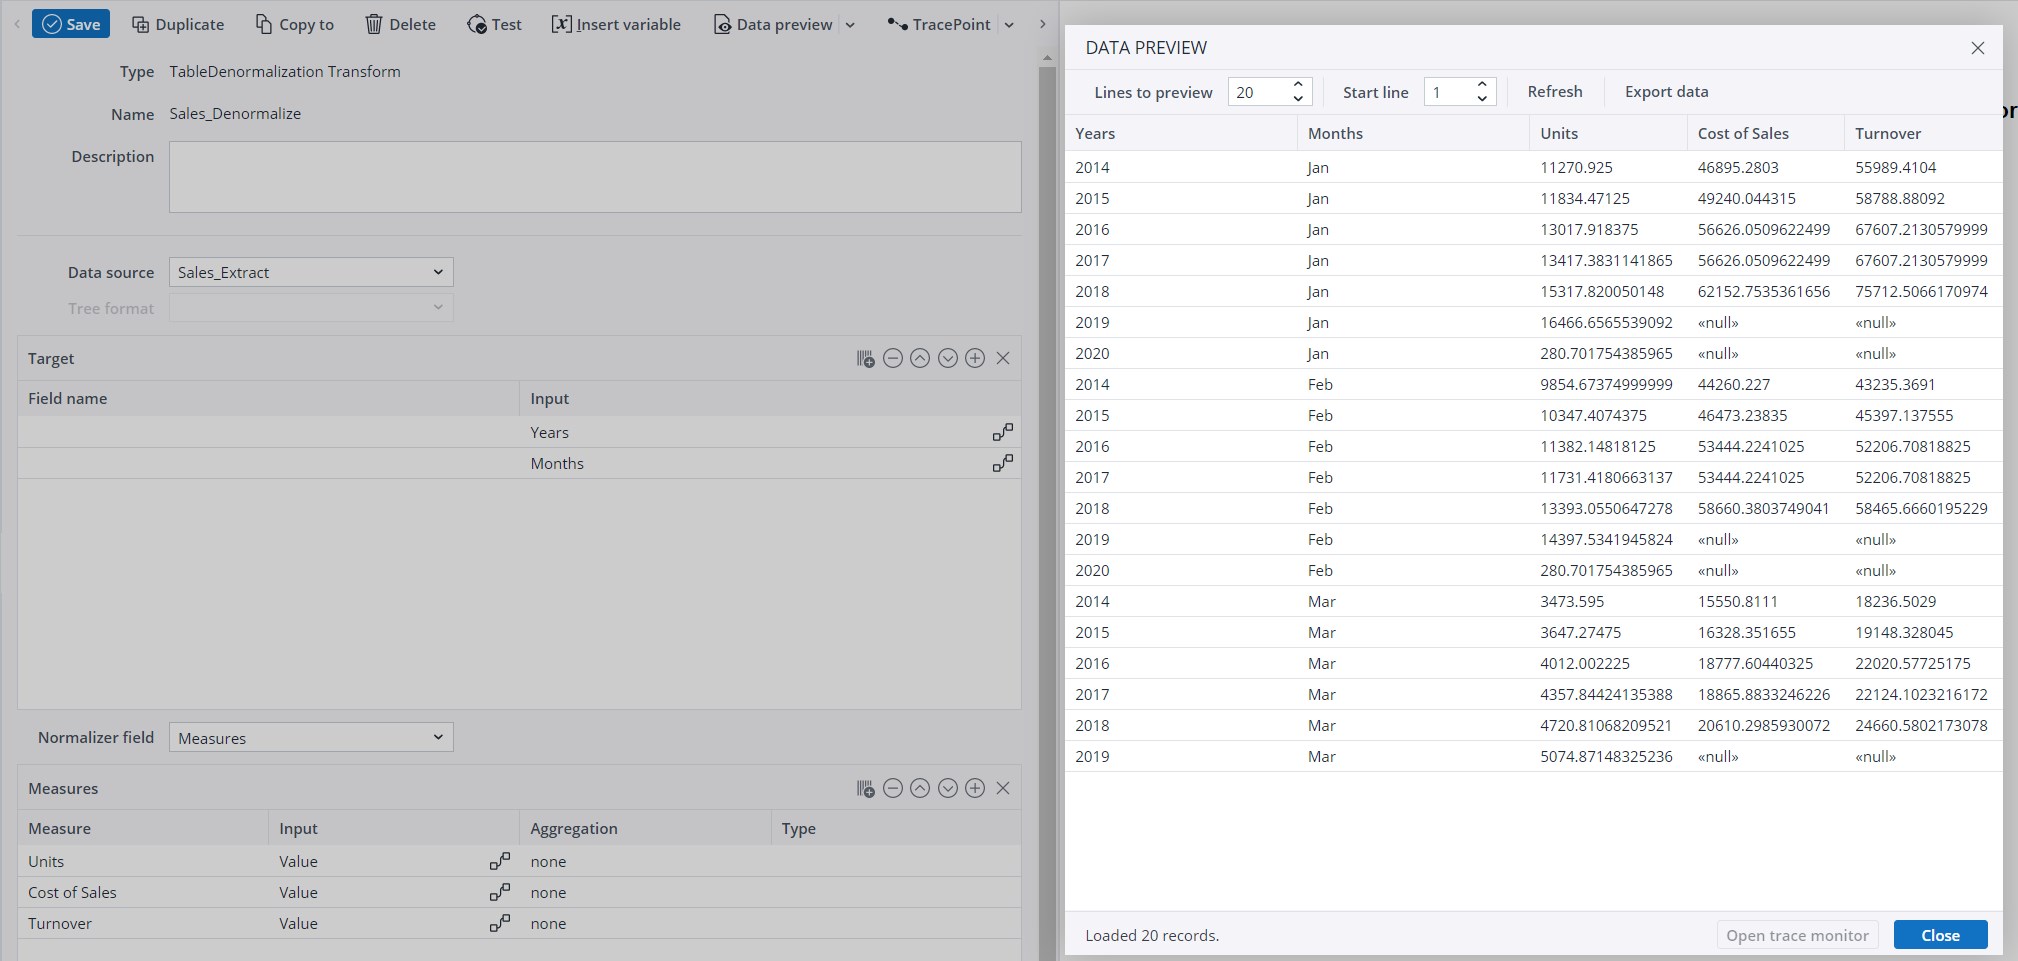
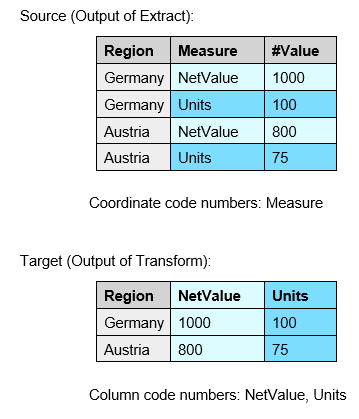
Denormalization is the reverse of normalization. Row-based data with key-value pairs is transposed into column-based data. This allows an OLAP model with one measure in each row (with the measure name as a key) to be arranged into a relational model in which the measures are held in various columns. The aggregation functions are the same as for TableAggregation transform.
If consecutive rows have the same key value for different measures, these rows are combined into a single row with all of these measures values. If the source rows are not ordered on key values and therefore "none" cannot be used, it is convenient to use the aggregate function "sum" for numerical values, and the aggregate function "max" for text values.
Dynamic Measure Source
The measures can be either defined statically in the measures table or retrieved dynamically from a source that is specified in "dynamic measure source". If both approaches are mixed, the dynamic measures, that are not defined statically, are appended at the end to the measures list. The dynamic measure source must have exactly one column with an arbitrary name, with each row defining one measure.
Dynamic measures have the following limitations:
- All dynamic measures have the same aggregation function, defined in "Measure aggregation".
- The name of the measures cannot be changed in the transform.
- The measure type is "numeric".
Notes:
-
In order to use as coordinates all source input columns which are NOT defined as dynamic measures, you have to set the "column include pattern" to "."
-
When the input is coming dynamically from the Source or Transform, but the "Field name" is left empty, the name of the source column/ function is used for the Field name. When the target is manually defined as constant, then the name "constant" is chosen instead of the value from the "Input" field. Adding more than one constant column results in error, because there would be two columns with the name "constant."
Examples for Denormalization
Example 1:
Settings and Preview in TableDenormalization Transform: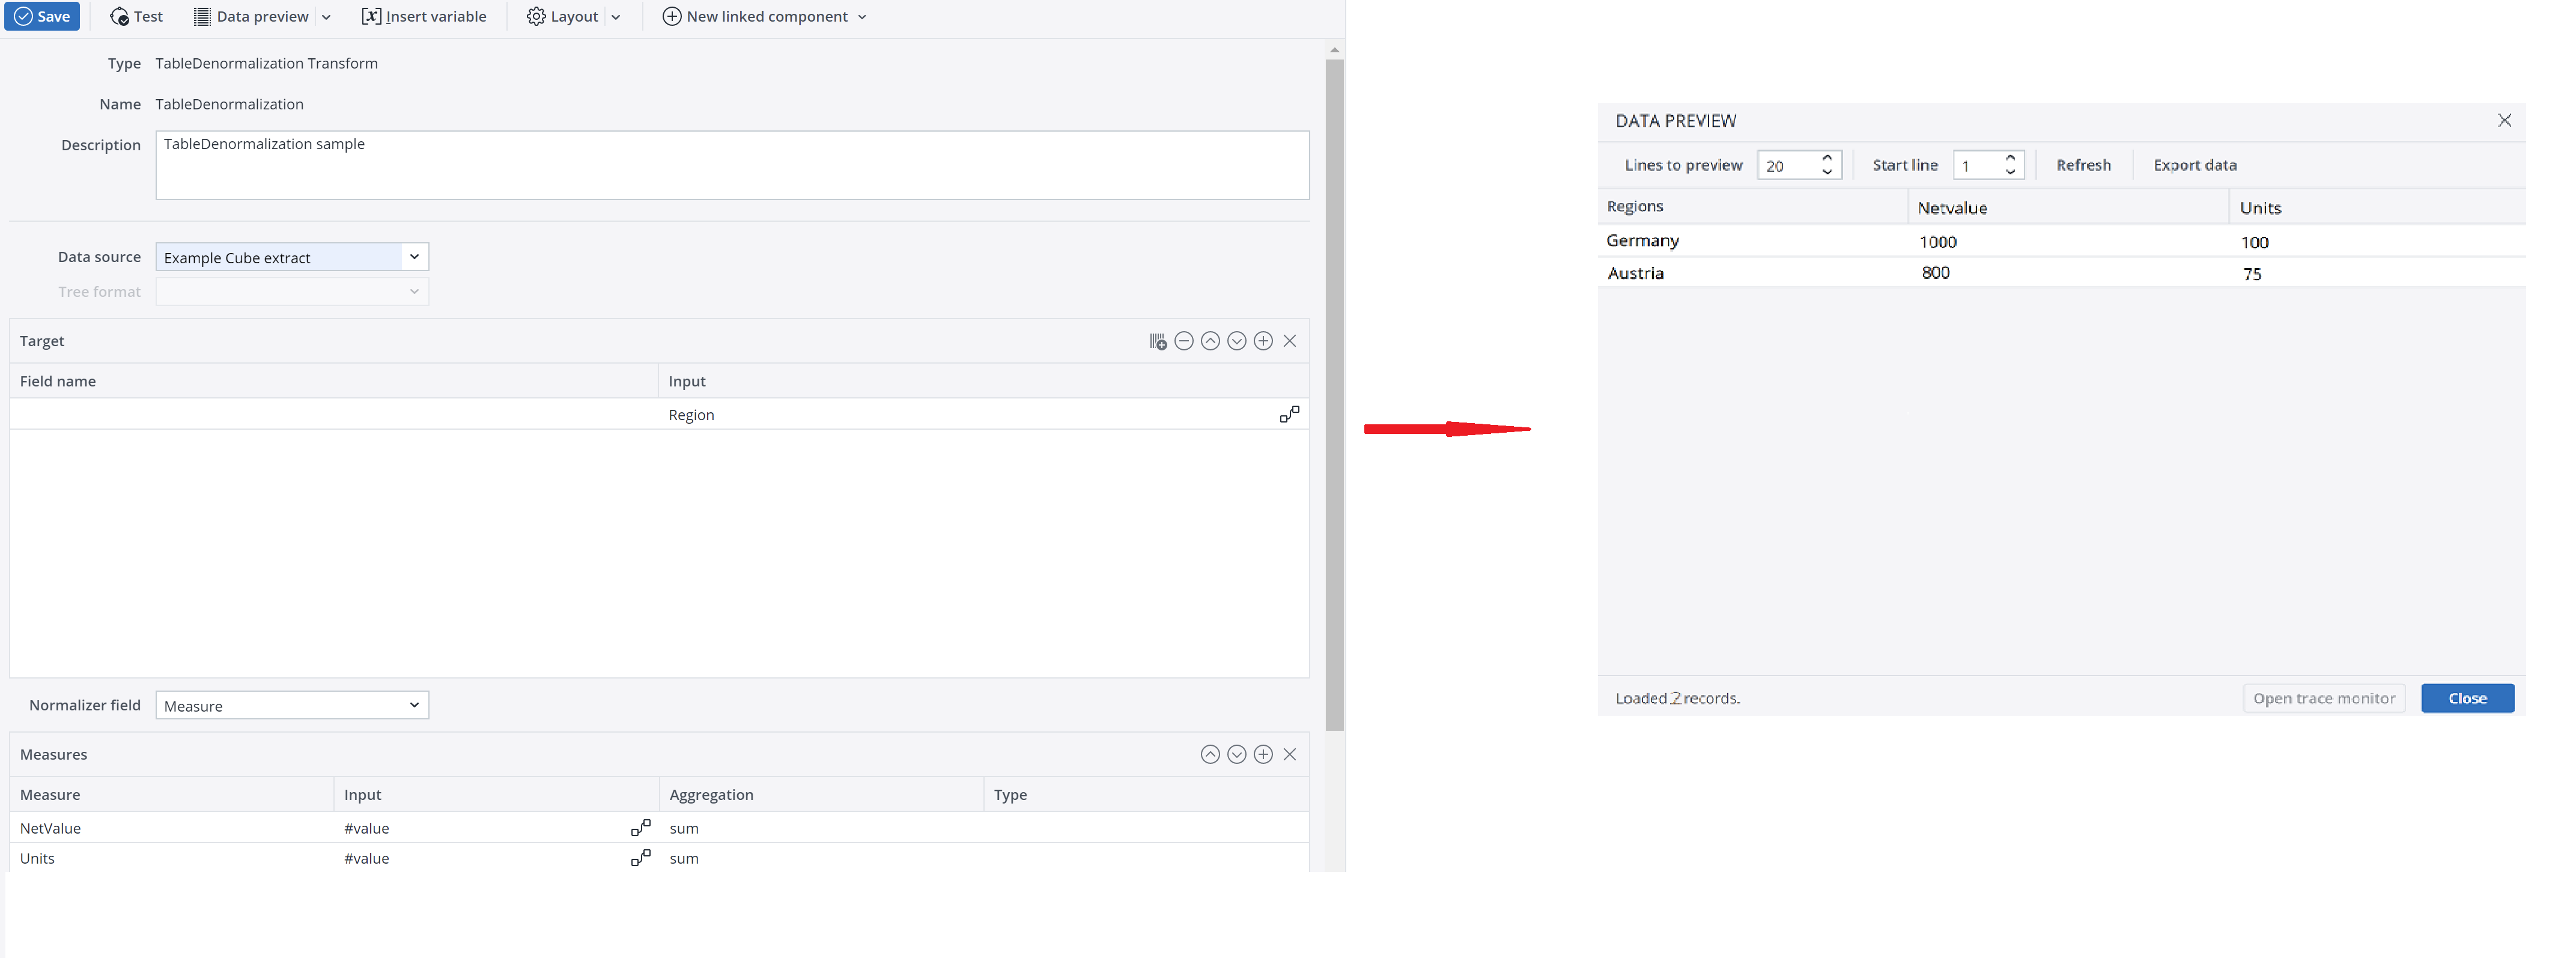
Example 2:
For this example, install the Integrator Samples from the Jedox Marketplace and open the sampleDenormalization project.
Source (normalized) as Extract Preview:
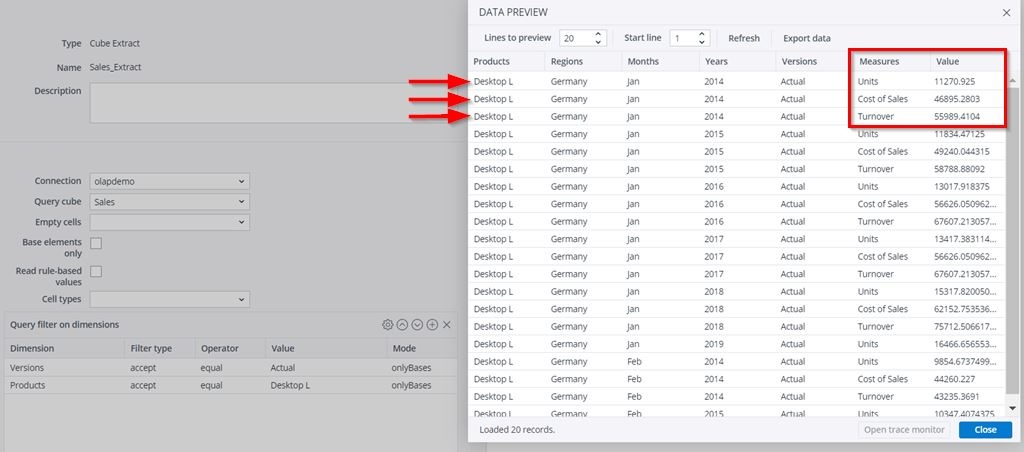
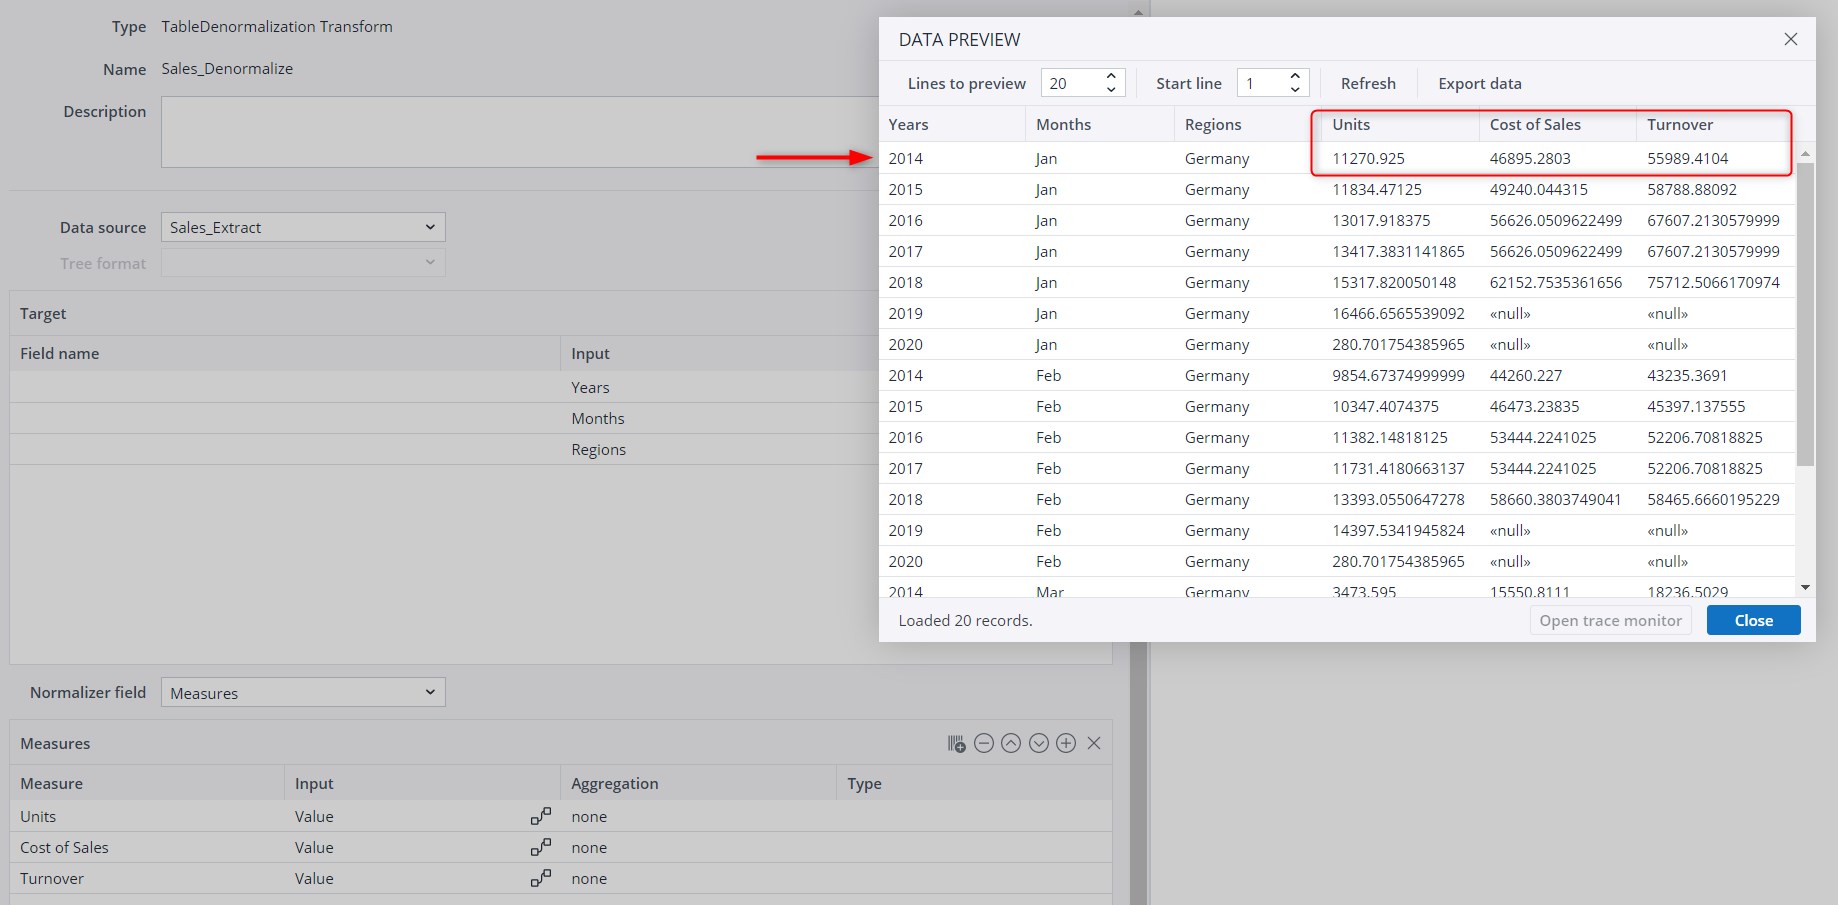
Select start line 121 in "Data Preview", because the lines in target preview are sorted differently!
Output of TableDenormalization Transform (denormalized):
Updated September 25, 2024
