This transform summarizes or groups your data according to a set of key columns and different aggregation functions. Some common functions of table aggregation include
- Grouping data in rows based on one or more key columns (e.g. customer_id, date, region).
- Applying aggregate functions, such as SUM, COUNT, MIN, MAX, AVG
- Reducing data volume by summarizing data for reporting and analysis
- Supporting business logic that reflects KPIs, such as monthly revenue or churn rate.
Transform settings
- Choose your data source and tree format, if applicable.
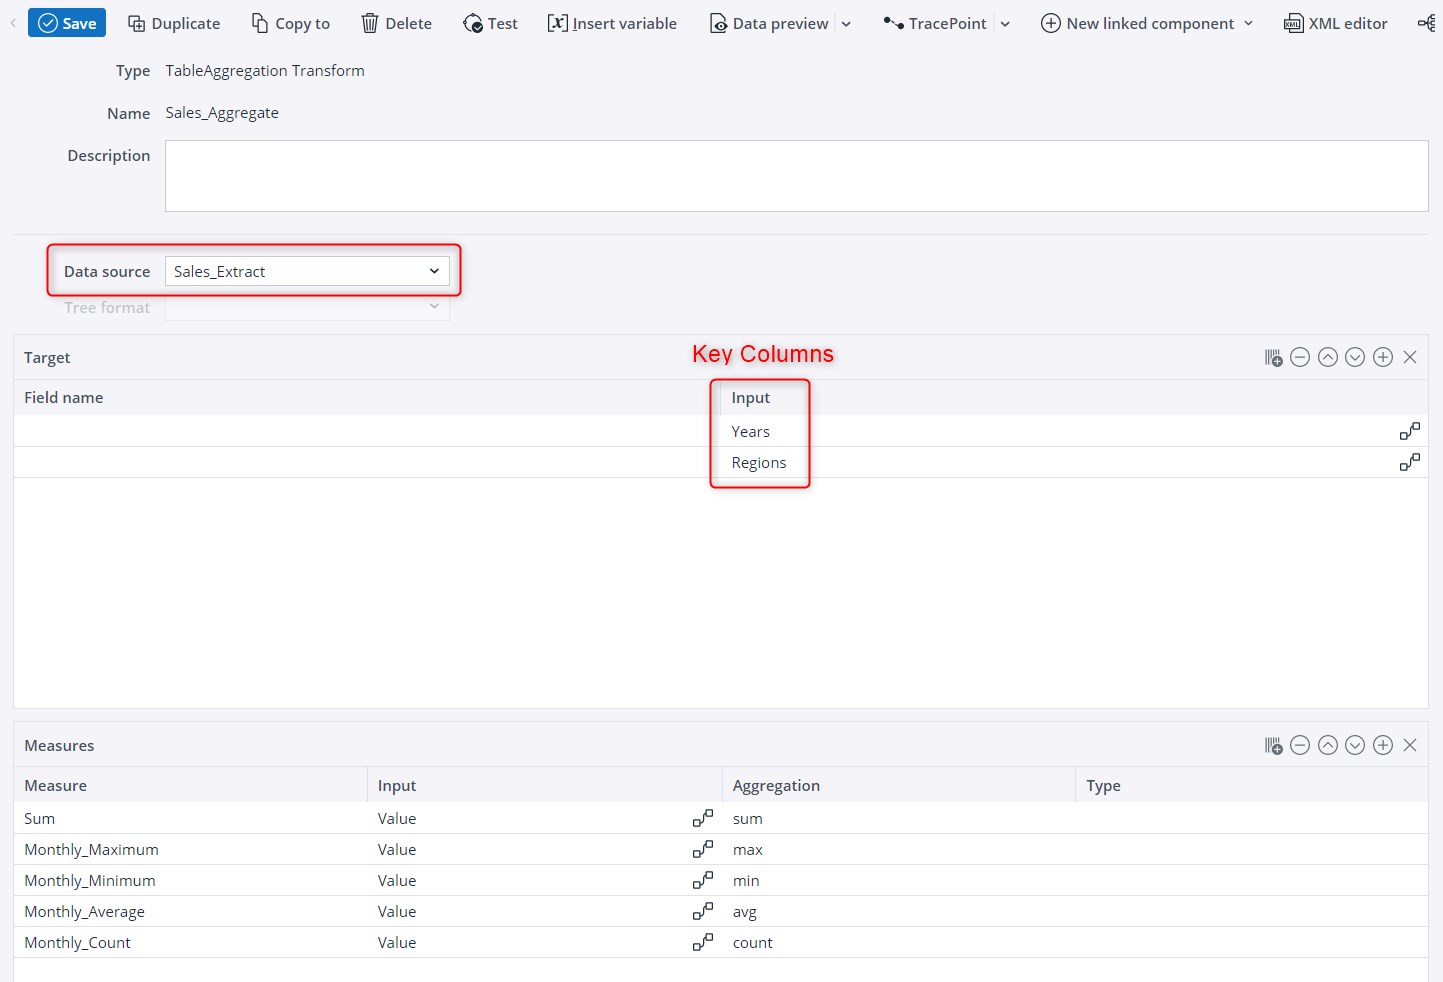
- In the Target table, go to the "Input" field and select the columns you wish to use as keys for the aggregation (see "Key Columns" in image below).
For example, if you choose "Regions" as a key column, all rows presenting the same value in this column in the source table (e.g. Germany) will be aggregated into a single row in the new table.
You may choose more than one key column, e.g. "Regions" and "Years". In this case, all rows presenting the same values in both key columns will be aggregated into a single row in the new table (for example, Germany 2018), and henceforth.
Furthermore, you can either keep the original names of the source columns, or define new ones by filling in the "Field name" area on the left-hand side of the Target table.1
- Next, go to the Measures table. Specify an aggregation function in the "Aggregation" field, and define the input value in the "Input" field.
The following aggregation functions are available for TableAggregation, TableNormalization, and TableDenormalization transforms:
sum Sum min Minimum max Maximum avg Average first The first data entry for one target position last The last data entry for one target position count Number of data entries written on one target position count_distinct
Number of distinct data entries written on one target position group_concat Concatenates all data entries with separator “,” while maintaining order of source rows concat_distinct Concatenates all distinct data entries with separator “,” (i.e. remove duplicate values); results are in ascending order selectivity Estimates the selectivity (0-100) of a value. The value is defined as (100 * distinctCount / rowCount). var_samp The sample variance (square of the sample standard deviation) stddev_samp The sample standard deviation var_pop The population variance (square of the population standard deviation) stddev_pop The population standard deviation none No aggregation occurs; the last data set is written (overwriting). For instance, you can choose the "sum" function and define "Value" as input. In this case, all rows having an identical value in the key column will be grouped into a single row, and their values will be summed and presented in a "sum" column in the new table. See the example below for a more detailed explanation.
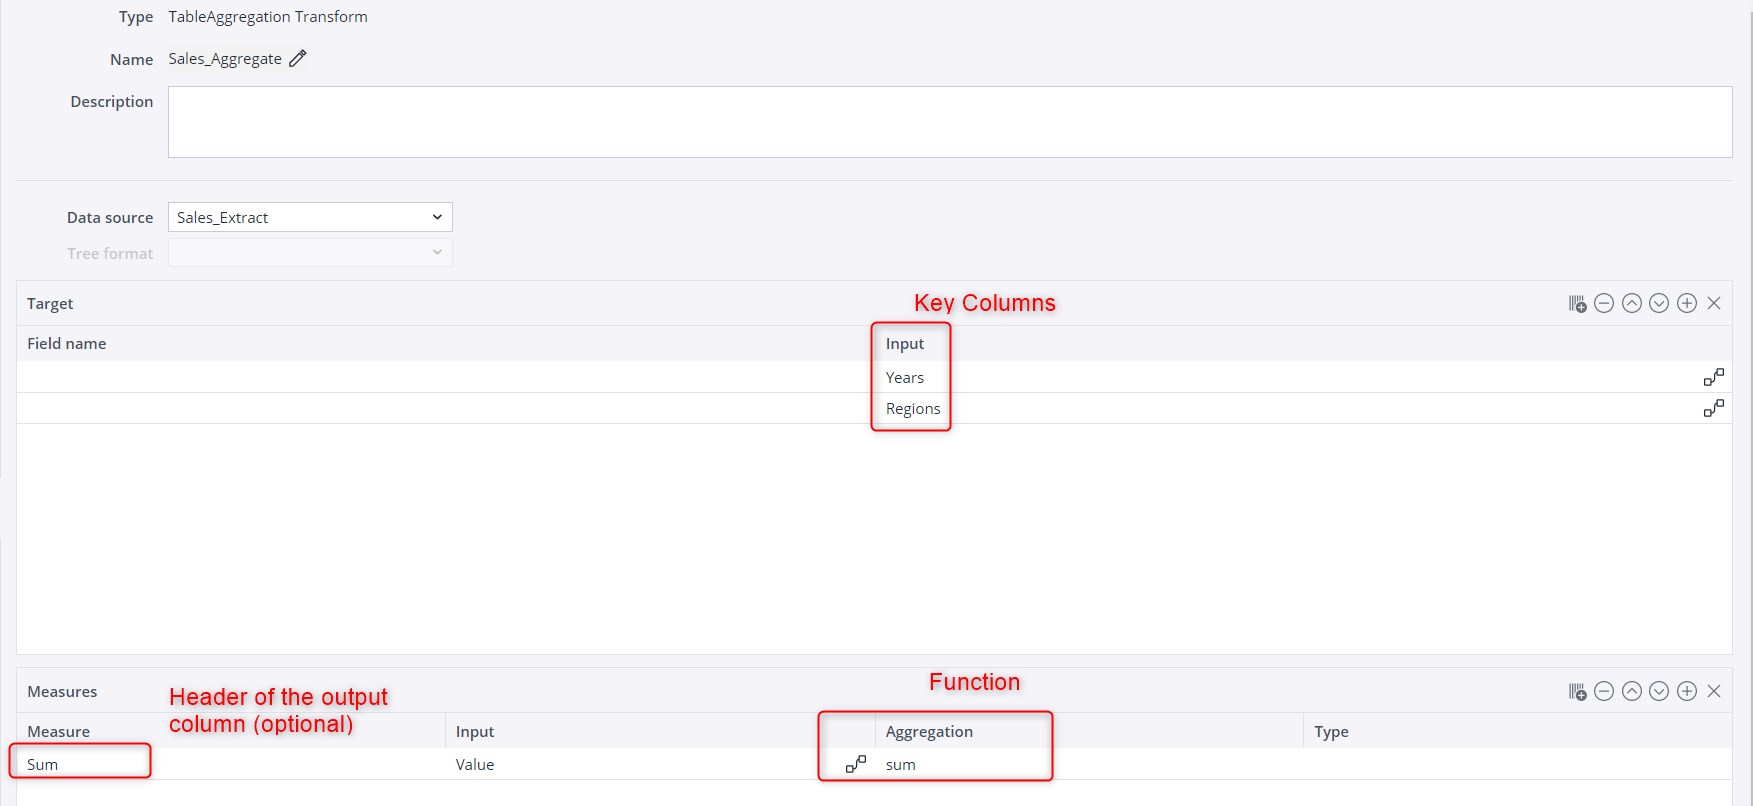
You can also define a different name for the header of the aggregation columns—just fill in the "Measure" field on the left-hand side. If this field is left empty, the function name will be the header of the aggregation column.2
The measure type can be defined as text, numeric (double), or integer. For mathematical aggregations (such as sum, max, min, avg, count), the measure type is numeric by default.
- You can further define the transform with the following settings:
Column include pattern Regular expression for column names to be included as output columns of the transform. Column exclude pattern Regular expression for column names to be excluded as output columns of the transform. Measure include pattern Regular expression for measure names to be included as output columns of the transform. Measure exclude pattern Regular expression for measure names to be excluded as output columns of the transform. Measure aggregation The aggregation function used for all measures which are added dynamically via the Measure include or exclude pattern. Concatenation separator Designate a custom separator for the operation. Keep source order If set, the order of output rows respects the order in the source with first appearance of a particular key. If not set, the order is arbitrary, but the performance might be better.
Use caching
If caching is activated, the complete output of the extract is temporarily stored during the first call of the extract, using an internal H2 database. Subsequent calls of the extract read directly from the cache without connecting to the underlying source system of the extract. If the extract or the underlying connection contains variables, a separate cache is build for different values of these variables.
See Caching in Extracts and Transforms for more information.
To remove duplicate rows, set "Column include pattern" to "." (i.e. the regular expression for "accept all") and no measures. To maintain the order of rows, set the option "Keep source order".
- After the changes, click Save.
Example
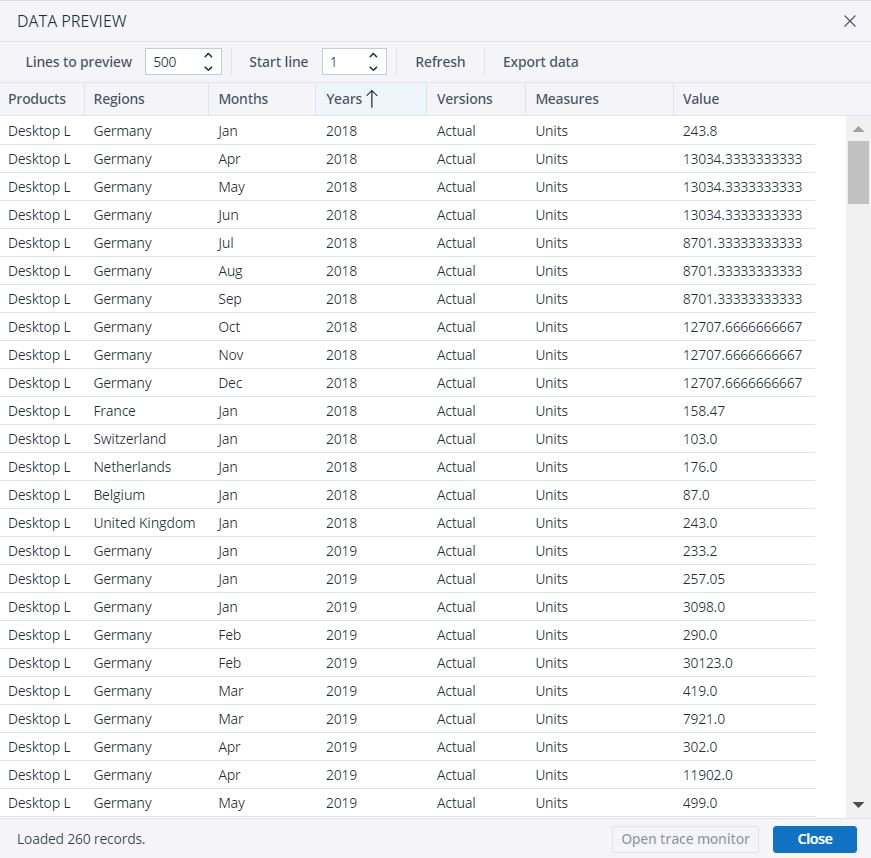
Consider you have the data below (just a sample here):
You wish to aggregate the data using the "Regions" and "Years" columns as keys, and sum their values. That means you need the "sum" function.
For this, select the key columns in the "Input" field in the Target table. Next, in the Measures table, select the "sum" function in the "Aggregation" field, and define "Value" as the "Input".
Save the changes.
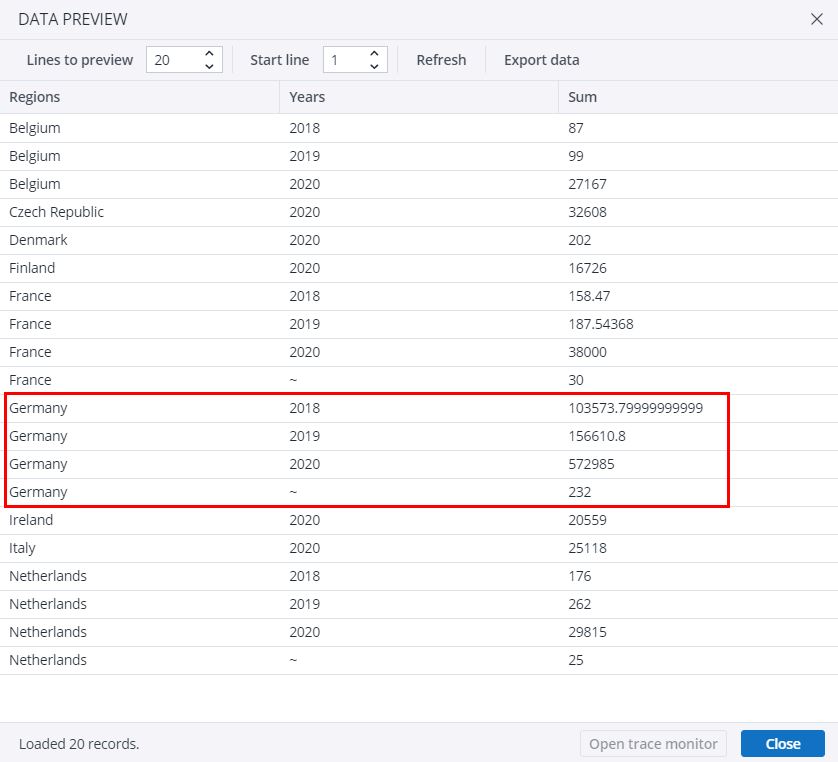
In the data preview, you can see that all rows showing a same country and a same year in the source table were grouped into a single row in the new table, and their values were summed in the "Sum" column. Check "Germany", for example:
1. This is the case when the input is coming dynamically from the source or transform. When the target is manually defined as constant, the name "constant" is chosen instead of the column name in the "Input" field. Therefore, adding more than one constant column results in error, because there would be two columns with the name "constant".
2. When the "Measure" field is left empty, the name of the "Input" field is chosen as column name. However, more than one empty "Measure" field with the same "Input" value results in error, because there would be two columns with the same name.
Updated January 20, 2026


