Return to Human Resources Model Overview
This report shows data and information for wages and salary for several planning versions, such as Budget and Forecast. The data is stored in the Personnel Costs cube.
Report Heading
The screenshot below shows the heading area of the Human Resources Wages and Salaries report. The report heading updates dynamically as various reporting options are selected. The logo can be changed in Administration; see Configuring Design Elements for more on report design.
The heading area of the report displays the following fields:
|
Field |
Description |
Implementation |
|
Title |
Name of the report |
Name of the report in Report Designer |
|
Subtitle |
Current PoV selection |
Localized subtitle will update as PoV selections are made |
|
Arrow |
Show/hide PoV widget |
Click on the arrow to display or hide point-of-view selections |
Point of View (PoV) Options
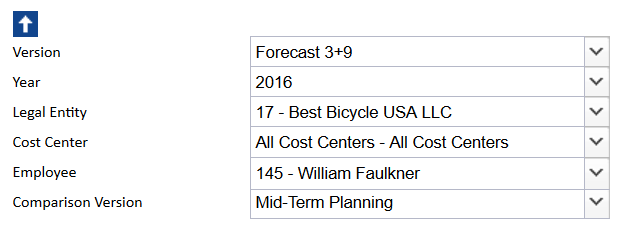
The content of the report can be customized using the PoV options, which can be viewed by clicking the blue arrow at the top of the report. 
This report uses a cascading logic. The selection made in the Legal Entity Combobox influences the displayed results of the Cost Center Combobox which in turn influences the content of the Employee Combobox. If there is no value stored in the cube for the chosen Combobox selection, an entry line for Salary Increase amount or Gathering Hours will be displayed. Otherwise, other salary or wage-related positions will be displayed.
The available options are described below:
|
PoV Option |
Description |
Implementation |
|
Version (Combobox) |
Select a planning version. |
|
|
Year (Combobox) |
Select a reporting period. |
Elements matching the pattern |
|
Legal Entity (Combobox) |
Select one single legal entity or any consolidated element. |
Elements of |
|
Cost Center (Combobox) |
Select one single cost center or any consolidated element. |
|
|
Employee (Combobox) |
Select one single employee or consolidated element. |
|
|
Comparison Version (Combobox) |
Select one planning version for comparison (or none). | Version dimension, filter for Stylesheet attribute equals BU or FC |
Report Columns and Rows
The columns and rows displayed in the report depend on the selections made in the PoV area. The screenshot below shows a report displaying Forecast 3+9.
Below are descriptions of the rows and columns in the Human Resources Wages and Salaries report.
|
Field |
Description |
Implementation |
|
Row label (Personnel Costs measure) |
Personnel costs measure shown as localized name |
Some preselected elements from the Values entered for Salary Increase Amount for a specific month will apply to the displayed results through the end of the year. Values entered for Salary Increase % (value should be a percentage value) for a specific month will increase salary based on salary and percentage value. Results of this calculation will be displayed through the end of the year. Values entered for Hours and Hourly Rate (Change) for a specific month will display this calculation for a specific month. |
|
Area visualization of version |
Fill and border style for version |
|
|
BU FC x+y |
Displays selected comparison version. if “None” is selected, this column does not appear. |
Element of |
|
yyyy (OB) |
Displays measure values at beginning of year |
Element of |
|
MMM |
Displays measure values during year |
Elements of |
|
yyyy |
Displays measure values for end of year |
Element of |
|
ΔBU% ΔFC x+y% |
Displays the element selected in Comparison Version Combobox; if “None” is selected, this column does not appear. |
Percentage change of selected version to comparison version |
Cell Locking
For all planning reports, data entry is only possible when a single legal entity, a single cost center and a single employee are selected. Cell locking prevents the entry of data in fields that draw on multiple sources.
Every account in the Personnel Costs_measure dimension contains the PCalculation attribute, which defines the rule that is implemented on the element. When this attribute is populated, cell locking is activated in the planning reports and data cannot be entered.
For example, in the first screenshot below, the Wage element contains information for PCalculation. Thus, the planning report will NOT allow values to be written to the database.
In the Human Resources Wages and Salary report, data can be entered in forecast months that are indicated with a reversed hatched area:  The area where data entry is possible is indicated by a gray box
  as shown in the screenshot below:
Updated August 13, 2025


