Return to Human Resources Model Overview
This report shows personnel costs and data that are stored in the Personnel Costs cube. It focuses on comparison of data via charts. Figures can be analyzed based on years, quarters and months.
Report Heading
The screenshot below shows the heading area of the Human Resources Time Series report. The report heading updates dynamically as various reporting options are selected. The logo can be changed in Administration; see Configuring Design Elements for more on report design.
The heading area of the report displays the following fields:
| Field | Description | Implementation |
|
Title |
Name of the report |
Name of the report in Report Designer |
|
Subtitle |
Current PoV selection |
Localized subtitle will update as PoV selections are made |
|
Arrow |
Show/hide PoV widget |
Click on the arrow to display or hide point-of-view selections |
Point of View (PoV) Options
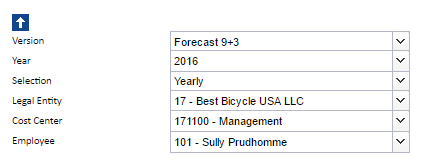
The content of the report can be customized using the PoV options, which can be viewed by clicking the blue arrow at the top of the report. 
The available options are described below:
|
PoV Option |
Description |
Implementation |
|
Version (Combobox) |
Select one forecast for comparison. |
|
|
Year (Combobox) |
Select a reporting period. |
Elements matching the pattern yyyy or FYyyyy of |
|
Selection (Combobox) |
Select a time format to display data (yearly or monthly). The quarterly time format can be added via the Time Editor. | Elements matching the pattern yyyy, FYyyyy, FYyyyy-MM, yyyy-MM, or yyyy-QQ of Month dimension |
|
Legal Entity (Combobox) |
Select one single legal entity or any consolidated element. |
|
|
Cost Center (Combobox) |
Select one single cost center or any consolidated element. |
|
|
Employee (Combobox) |
Select one single employee or any consolidated element. |
|
Report Columns
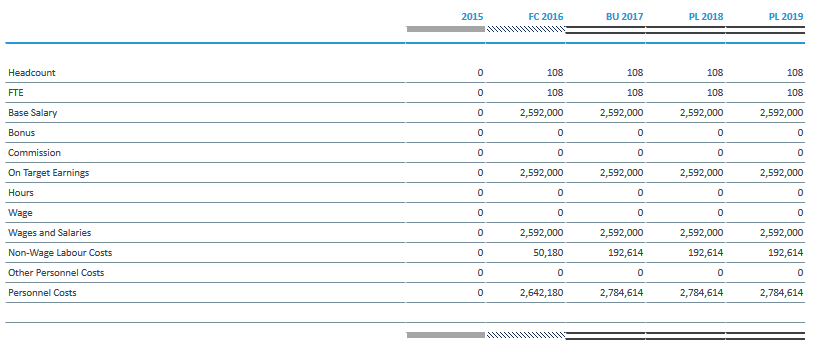
The columns displayed in the report depend on the selections made in the PoV area. The screenshot below shows a report displaying Forecast 9+3, with Yearly Selection.
The columns are described below:
|
Field |
Description |
Implementation |
|
Row Label |
Account shown as localized name |
|
|
Area visualization of version |
Fill and border style for version |
|
|
Time |
Selection of time period |
Elements matching several patterns:
|
Updated July 21, 2025


