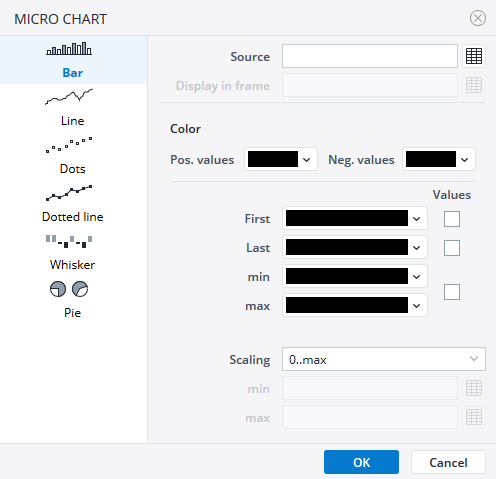
Micro Charts allow you to see graphical representations of your data directly in the cell. To insert a Micro Chart, follow these steps:
- On the Insert menu in Jedox Web, click on the Micro Chart icon
 . The Micro Chart dialog opens:
- Based on the type of chart you want to insert, select the following: Micro Chart type, the cell range for the data source, the frame where you want the Micro Chart displayed, the colors for each type of value and the scaling limits.
- Click OK. The Micro Chart is displayed in the cell you selected.
- You can change the size of the Micro Charts by adjusting the font size of the spreadsheet cell where the chart is displayed. The change of the size will be applied the next time the workbook is opened.
Examples:
Notes:
-
If you chose to use a Micro Pie Chart, you must multiply the source value in the formula by 100 to correctly display the value in the Micro Chart, like in the example below:

-
The second parameter in the spreadsheet formulas which are used to generate Micro Charts is not currently used, and its value should always be an empty string.

Updated July 3, 2025
