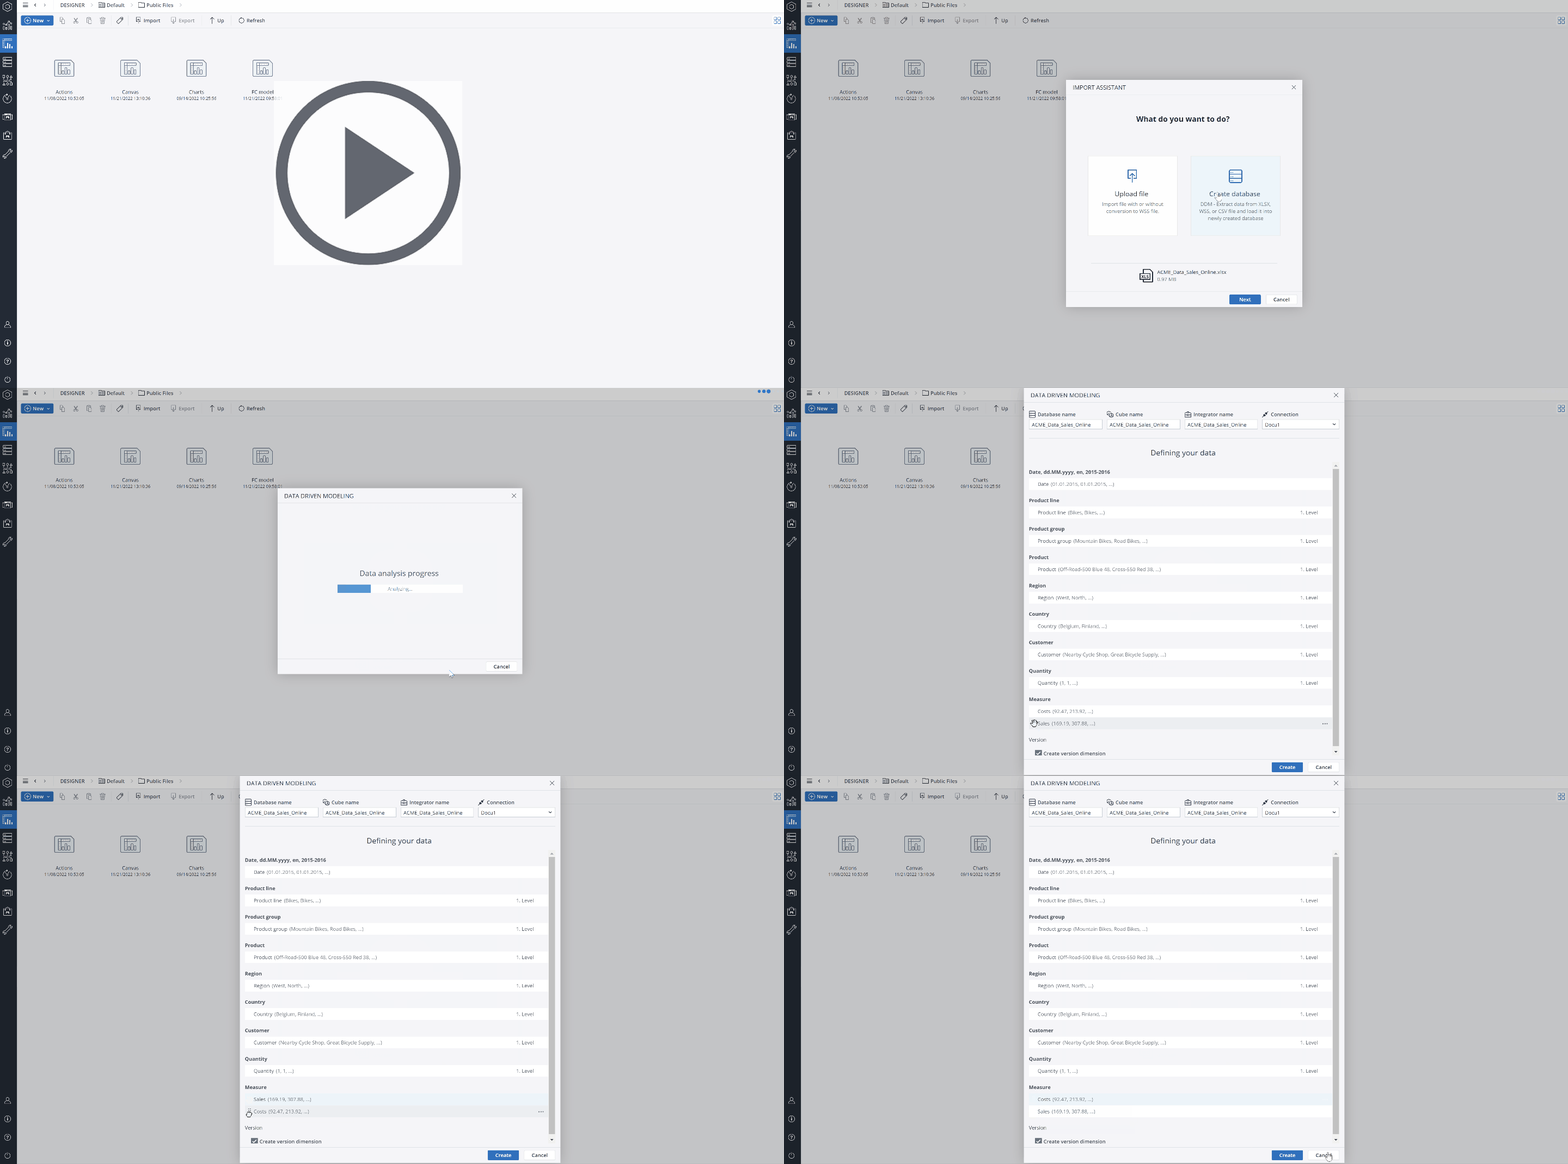
Data-driven modeling is an innovative process that enables you to analyze existing data earlier and faster. Instead of creating data cubes manually, data-driven modeling allows you to generate and fill a new Jedox data cube with your existing data in CSV or Excel content. Jedox models the data cube from existing data automatically and intelligently. Additionally, data-driven modeling creates a complete Jedox Integrator (ETL) script that can be further specified and used to populate the data cubes on a periodic basis.
Simply upload data from your ERP, CRM, or other source systems in an Excel file. You can even drag the data file directly into the Designer. Jedox analyzes the structure of the file and automatically creates a database and a project in seconds. Smart, data-driven modeling automatically recognizes dimensions and data types. You can modify the structure of your model using intuitive drag-and-drop functionality.
A data-driven modeling process generates two predefined global Subsets *All and *Base for all dimensions.
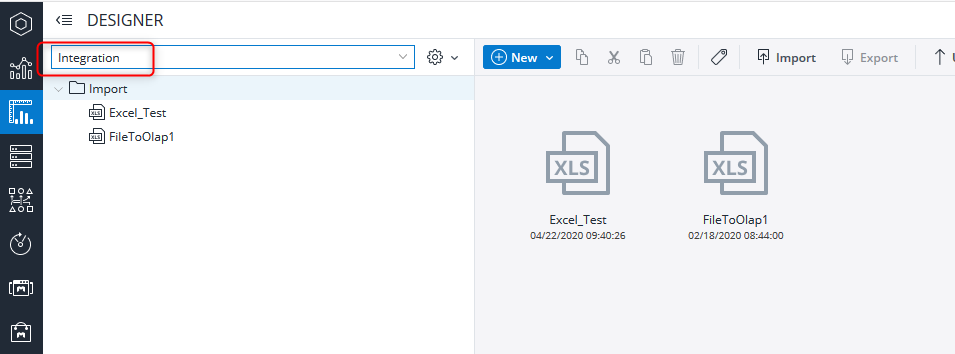
Note: when using data-driven modeling, a new folder named "Integration" is automatically created in Jedox Web Designer, and source data files are stored inside that folder.
It is also possible to access the data-driven modeling dialog directly from Excel Add-in. Go to the Jedox ribbon and click on the Data-Driven Modeling button:
Configuration requirements
Jedox Web and Jedox Integrator must be installed. Data-driven modeling is by default set for a maximum file size of 128 MB. This default value can be changed in the file <install_path>\httpd\php\php.ini in the lines post_max_size and upload_max_filesize. To disable the limit, set the post_max_size value to 0.
Rights requirements
A user requires delete (D) rights on the following rights objects: database, cube, dimension, dimension element, cell data, ste_files, ste_etl, and ste_reports.
Preparing source data for data-driven modeling
This section describes the way a data file should be prepared for data-driven modeling.
The imported CSV or XLSX source file can contain meta information for the dimensions and the cube that will be generated. This information can be given in a suffix of brackets, e.g. [Products,1], where you can specify individual levels of a dimension, dimension attributes, measures, time dimensions, and drillthrough columns.
This information, which is contained in the uploaded file, can be changed in the Data-Driven Modeler.
Possible bracket information:
[<Level>]
The column is Level <level> of a dimension with the column name.
Examples:
“Products[3]” : Level 3 of Dimension Products.
“Products[B]” : The level of base elements of Dimension Products, as alternative to the index of the base element level.
[<Level>,<Dimension>]
The column is Level <level> of a dimension with name <Dimension>.
Example: “Region[2,Country]” : Level 2 of Dimension Country.
[<Level>,<Dimension>,CONCAT]
The column is Level <level> of a dimension with name <Dimension> where the element names are concatenated over all upper levels.
Example: “Region[2,Country,CONCAT]” : Level 2 of Dimension Country with element names e.g. “Europe”, “Europe-West”, “Europe-South”.
[ATTR,<Level>,<Dimension>]
The column is an attribute with the column name for Level <level> of a dimension with name <Dimension>.
Example: “Description[ATTR,Country]” : Attribute Description for Level 2 of Dimension Country.
[ATTR,<Level>,<Dimension>,<Attribute>]
The column is an attribute with name <Attribute> for Level <level> of a dimension with name <Dimension>.
Example: “Region[ATTR,Country,Description]” : Attribute Description for Level 2 of Dimension Country.
[MES]
The column is a measure that will be normalized to dimension “Measure” with the column name as keyfigure name.
Example: “Cost of Sales[MES]” : Normalization is done with dimension “Measure” and keyfigure Cost of Sales.
[MES,<Keyfigure>]
The column is a measure that will be normalized to dimension “Measure” with keyfigure name <Keyfigure>.
Example: “column17[MES,Cost of Sales]” : Normalization is done with dimension “Measure” and keyfigure Cost of Sales.
[IGNORE]
The column is ignored. Same result when no bracket is used.
[DATE,<sourceformat>,<targetformat>]
A dimension based on a Calendar-Extract with column name is created. The column has to contain date-values in the sourceformat. The Calendar Extract will create base elements in the targetformat (and other upper levels and YTD-levels). For the targetformat only symbols ‘d’, ‘M’ and ‘y’ are allowed.
Example: Date[DATE,dd.MM.yyyy,MMM yy] : A dimension Date with base elements of form “Jan 14” is created, the column has to contain values in the form “30.01.2014”.
[DATE,<sourceformat>]
A dimension based on a Calendar-Extract is created with same sourceformat and targetformat.
Example: Date[DATE,dd.MM.yyyy]
[DATE,<sourceformat>,<language>,<start year>,<end year>]
A dimension based on a Calendar Extract is created. The years level is created from start year to end year. If not specified default values 2010 and 2015 are used
Example: Date[DATE,dd.MM.yyyy,MMM yy,EN,2013,2014]
[DRILL]
The column is not part of the Cube but only a column of the Persisted Drillthrough with the column name.
Example: Orderline[DRILL] : Drillthrough is done with a drillthrough column Orderline.
No bracket
Same as [IGNORE], i.e., the column is ignored.
Some rules:
- If no column with [MES] is found, no normalization is done. In this case, the last column has to contain the cube value, independent of its column name.
- The order of the column is not important (except the rule above on the last column for cube values).
- Each dimension gets a root node in the form “All Products”.
Updated July 21, 2025

