The Jedox In-Memory DB includes a built-in Server Browser with many performance-monitoring features. Below are some of the statistics that can be monitored.
Note: to access the Server Browser, the admin port must be enabled in the palo.ini. For more information, see Jedox In-Memory DB Server HTTP API and Server Browser.
Global rule calculation counters
The rule calculation counters track null/zero/error rule results and overall time spent in rule calculation since the last OLAP server startup. These numbers can help you find performance issues related to handling extensive data and calculating formulas with no result. The stats can be reset via the "Reset Statistics" link on the engine page, which can be found at http://localhost:<port>/browser/engine.

Individual rule counters
The cube rules page (server/database/cube/rules) now has columns with per cube statistics:

With total (non-null) number of values calculated by rule, number of values that were null/zero/error and total time spent in rule calculation.
The counter may not be updated when significant optimization is used, e.g. when aggregating continuously over billions of cells.
Overall evaluated Plan Nodes statistics
http://localhost:<port>/browser/engine:

This table shows counters for all types of nodes since server start. In this example, you can see that besides rules were used to multiply, subtract and divide tens of thousands of numbers. This is not too interesting for daily use but could help to identify what version of a rule generates more load for the engine. Statistics can also be reset.
Cube cache overview
Inter-cube cache dependancies. List of cube IDs their data change triggers invalidation of a browsed cube. It can be found via OLAP browser links server/database/cube in the "dependences" field:

The picture shows statistics about the cube "Project Monthly Forecast" with ID: 420 that has 10,229,877,843 cached cells - all of them null (cached values shows 0). To calculate these cached cells OLAP had to fetch data from cubes 23:52,23:142,23:420 These numbers represents pairs of database-id:cube-id of source cubes. Database ID 23. Cube IDs 52,142 and 420.
Cube cache content
Clicking on analyze link from Cube page will open Cube Analyzer page. It newly contains a section describing cached areas of the cube:
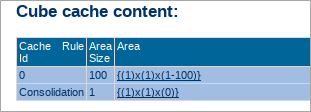
The first column identifies cube rule used to evaluate cached cells. The second represents the size of the area – total cached cells. The third contains a definition of the cached area that can either be used in OLAP http function parameter area, or when clicked, it displays cache content in the format specified here: http://localhost:<port>/api/cell/export
Long lasting calculations - calculation stack
It can be analyzed in System/#_JOBS_ Cube
http://localhost:<port>/browser/cube/?area=*,*,*&name_database=System&cube=9
or via server/database System/cube #_JOBS_/path *,*,*

Last row contains current calculation stack:
25;27;;0,0,0;1;5.43734;C;
25;27;0;{(1-1000)x(1-1000)x(1-100)};100000000;0.028941;C;
Each line contains the ID of the database, the ID of the cube, and ID of the rule (empty if consolidating). The cell path or area definition in a compact form. The size of the calculated area on that level. The time elapsed since the beginning of the calculation step in seconds (0.028941 in this case). The C at the end stands for Calculation and could be also P for Planning.
In this example, we can see that OLAP started to calculate consolidated cell (0,0,0) of cube ID: 27 5.43 seconds before the stack was retrieved. This consolidated cell was expanded internally into 100,000,000 cells that are being evaluated using rule ID 0.
This information can be useful when trying to identify slow rules. It is usually the rule from last row that has significantly high calculation time.
Updated April 29, 2026