When you have set up the AIssisted™ Driver Analysis Wizard and executed a scenario, you can click the SHOW icon (![]() ) on the Overview Page to see its results (once the job has run and the status shows a green check mark).
) on the Overview Page to see its results (once the job has run and the status shows a green check mark).
The top section of the report summarizes the selected data in the scenario you set up. With this information, you can ensure that you are looking at the correct results.
The Driver Analysis Result Report features two table tabs: "Driver Analysis Explainable AI Result" and "Driver Analysis Significance Result".
The "Driver Analysis Explainable AI Result" table shows the type of impact on the target (compared to its average value). It displays Shapley values and gives an indication of how the impact factors and patterns relate to the target value. The impact factors are quantified by their contribution to the average value of the target, with absolute values shown in the graph on the left. The higher the number, the greater the impact.
The plot shows how the drivers generally interact with the target. You can select specific drivers (e.g. Temperature) to view its interaction with the selected target (e.g. Units). Click on the link "See more in video" for a more detailed description.

Switch to the "Driver Analysis Significance Result" table to see the list of drivers, grouped by their importance, from highest (three squares), to no effect (empty blue square), to negative result (red square). Note that not all levels are displayed.

Select the driver (in this case, Humidity) to display it graphically alongside the target measure (in this case, Units).
Adding analysis values to reports
There are two different sets of values on the results pages. The first page is Shap Analysis and is stored in a cube in the user's database called ShapAnalysis_UserCubeName, where UserCubeName is whatever cube was used as source data for the analysis task.
The second tab is Significance and is stored in a cube in the user's database called DriverAnalysis_UserCubeName, where UserCubeName is whatever cube was used as source data for the analysis task.
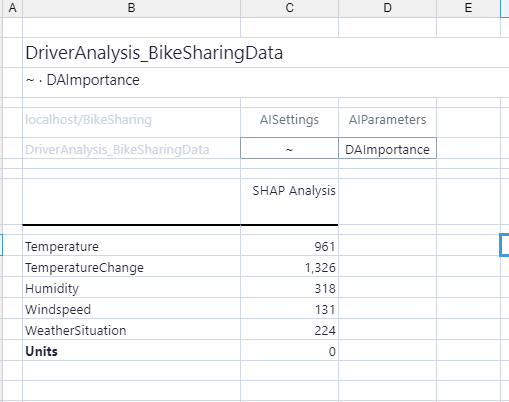
To access the Shap Analysis values in a View, choose the correct database and cube and then choose Measure for Column, and Accuracy: Shap Analysis for the row. AISettings and AIParameters: DAImportance should be in the POV. Remember that your AISettings should be whatever the scenario name you are working with.

The values next to the drivers are quantified on how much they contribute compared to the average value of the target. Higher numbers mean a higher impact.
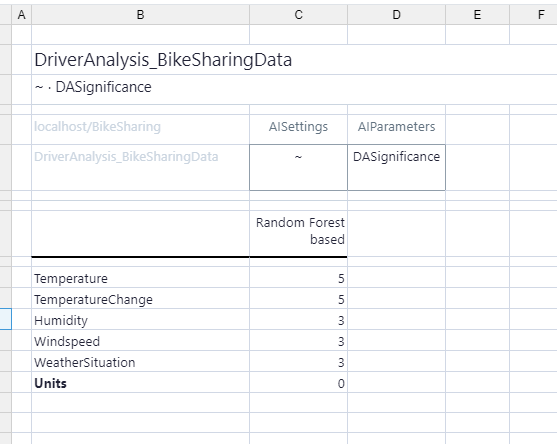
To see the significance, create a View with the correct database and cube and then choose Measure for Column, and Accuracy: Random Forest based for the row. AISettings and AIParameters: DASignificance should be in the POV. Remember that your AISettings should be whatever the scenario name you are working with.
Updated March 30, 2026