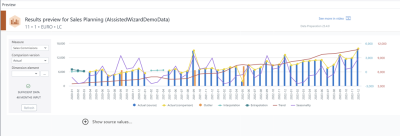
When you run Data Preparation, the AIssisted™ Data Preparation Wizard takes your source data and, depending on the setup, determines outliers and suggests values for gaps in data. The AIssisted™ Data Preparation Preview then shows these values along with a selectable version to compare.
The below example shows the extrapolation, interpolation, and outlier detection results for the measure Sales Commission and the Actual values as the Comparison version.
You can hide a line in the graph by clicking on the corresponding color-coordinated labels below the graph. If you want to see a table with these values, click on Show source values... under the graph.
The fields and functionality of the Data Preparation Preview are described below:
|
Field |
Description |
| Measure (combo box) | Choose the Measure element you wish to view for your data preparation values (e.g. Gross Revenue). You can select different Measure elements to show different results. |
| Comparison version (combo box) | Choose the Comparison version element you wish to use to compare with your prepared data (e.g. Actual). It is possible to select different Comparison version elements to compare with the predicted data; for instance, you can compare the suggested values of a given measure from the Actual to the Budget. |
| Refresh (button) | Refreshes the graph to show any changes made from a previously run data preparation setup. |
|
Actual |
The actual figures for the duration of your data preparation setup. The source is always the data you entered from the Version dimension, e.g. Actual, and will always be expressed in the table and graph. |
| Actual (comparison) | This is a dynamic figure that compares to the prepared data. Note: a change in the Comparison version element will be reflected in the table and graph; that is, if you switch it from Actual to Budget, the field in the table will become Budget (comparison), and Budget will be shown in the graph. |
| Outlier | The outlier detection data produced by the AIssisted™ Data Preparation Wizard. |
| Interpolation | The interpolation values produced by the AIssisted™ Data Preparation Wizard. |
| Extrapolation | The extrapolation suggestions produced by the AIssisted™ Data Preparation Wizard. |
Adding values to reports
AIssisted™ Data Preparation values are populated into the same cube you used as your source data, simply in the new version elements Outlier, Interpolation, Extrapolation, Trend, and Seasonality.
Updated September 25, 2024
