After you have set up the AIssisted™ Classification Wizard and executed a scenario, you can click the SHOW icon (![]() ) on the Overview Page to see its results (once the job has run and the status shows a green check mark).
) on the Overview Page to see its results (once the job has run and the status shows a green check mark).
The top area of the displayed dialog is a summary of all the settings in the scenario you set up. With this information you can ensure that you are looking at the right results.
The Classification Result section will show one of the following result reports, depending on the number of classes predicted: Result Report for Binary Classification and Result Report for Multi-class Classification.
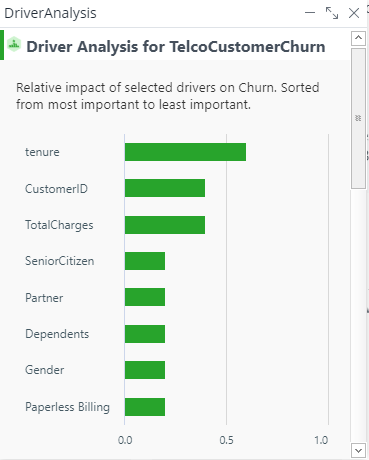
In either case, click on the "Show Driver Analysis" button directly to the right of the section title to see the relative impact of the selected drivers, sorted from most to least important.
Result Report for Binary Classification
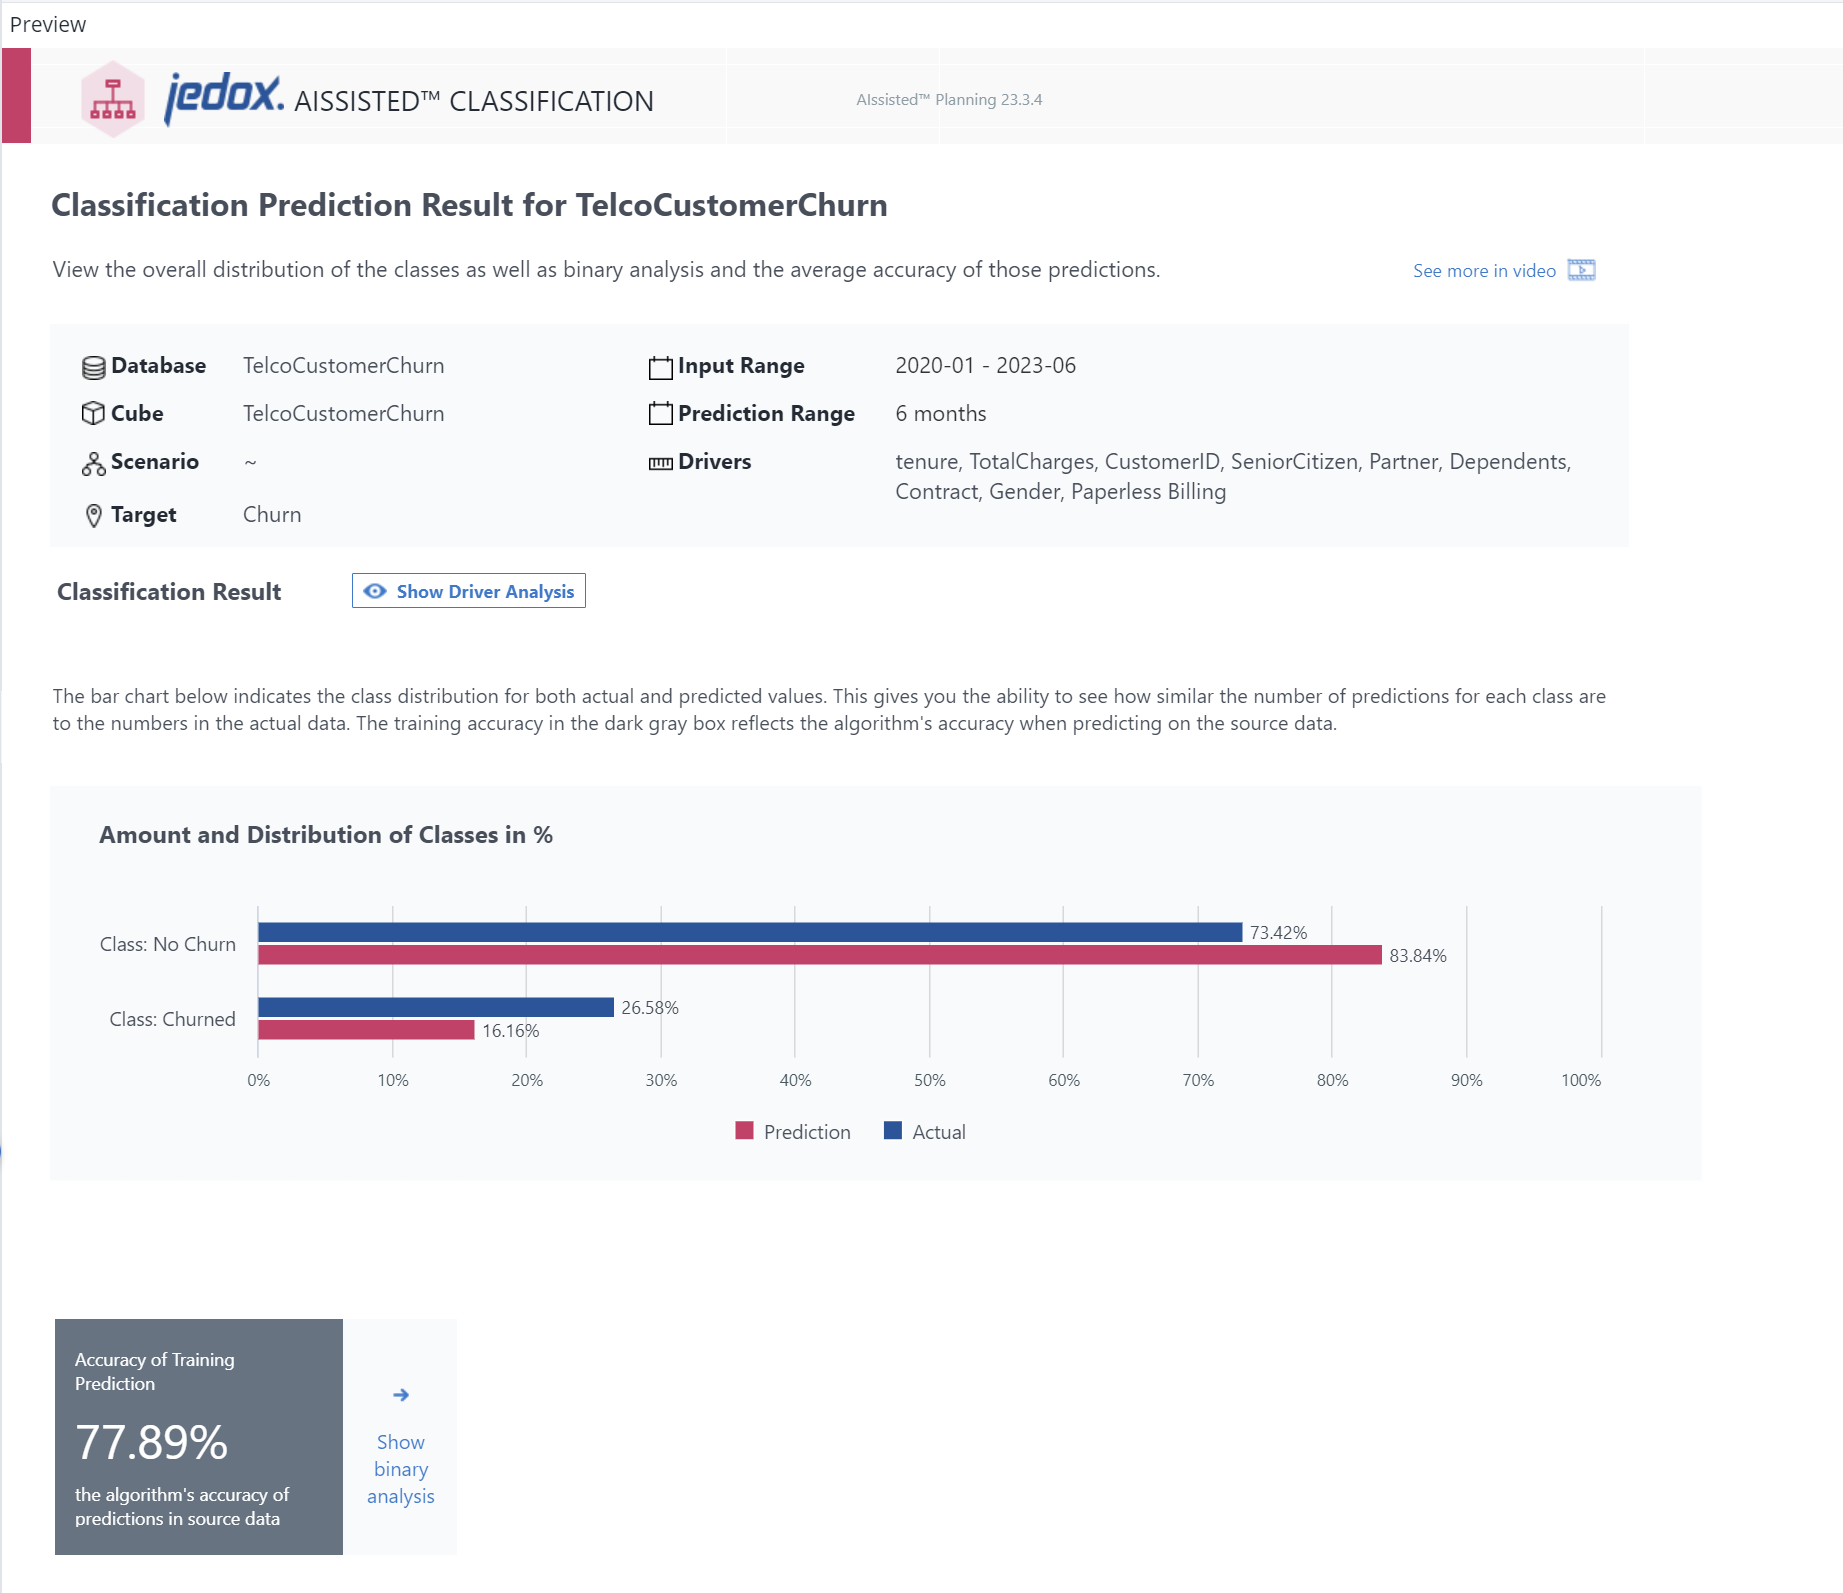
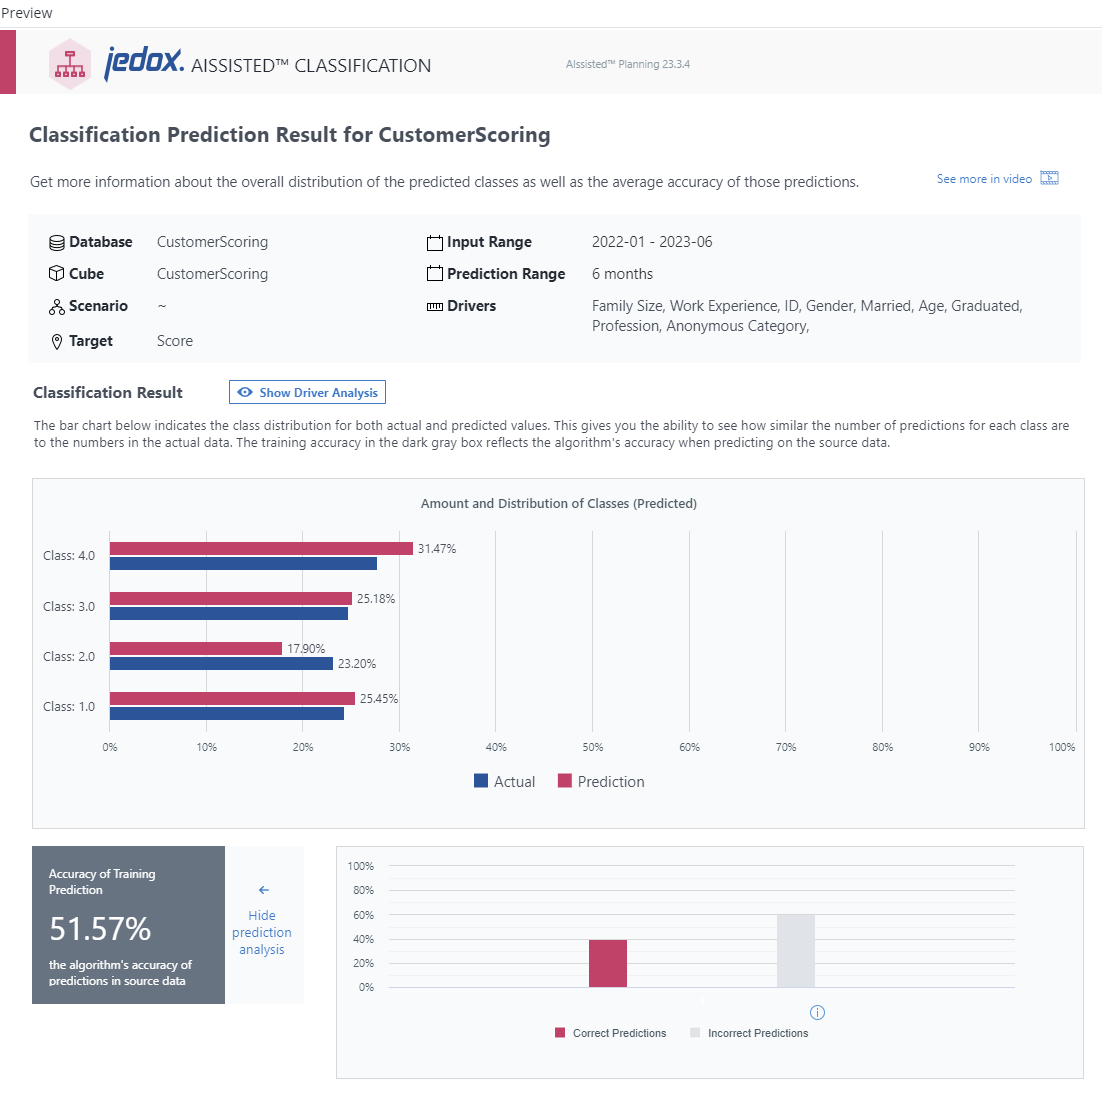
The bar chart which opens the section indicates the class distribution in percentage for both actual and predicted values. This gives you the ability to see how similar the number of predictions for each class are to the numbers in the actual data. In the example shown above, you can hover over the bars to see how often churn occurs or does not occur in the source data and predictions. Hovering over the Actual and Prediction chart key elements also highlights the respective bars on the chart.
The training accuracy in the dark gray box below the chart reflects the algorithm's accuracy when comparing predictions to the source data.
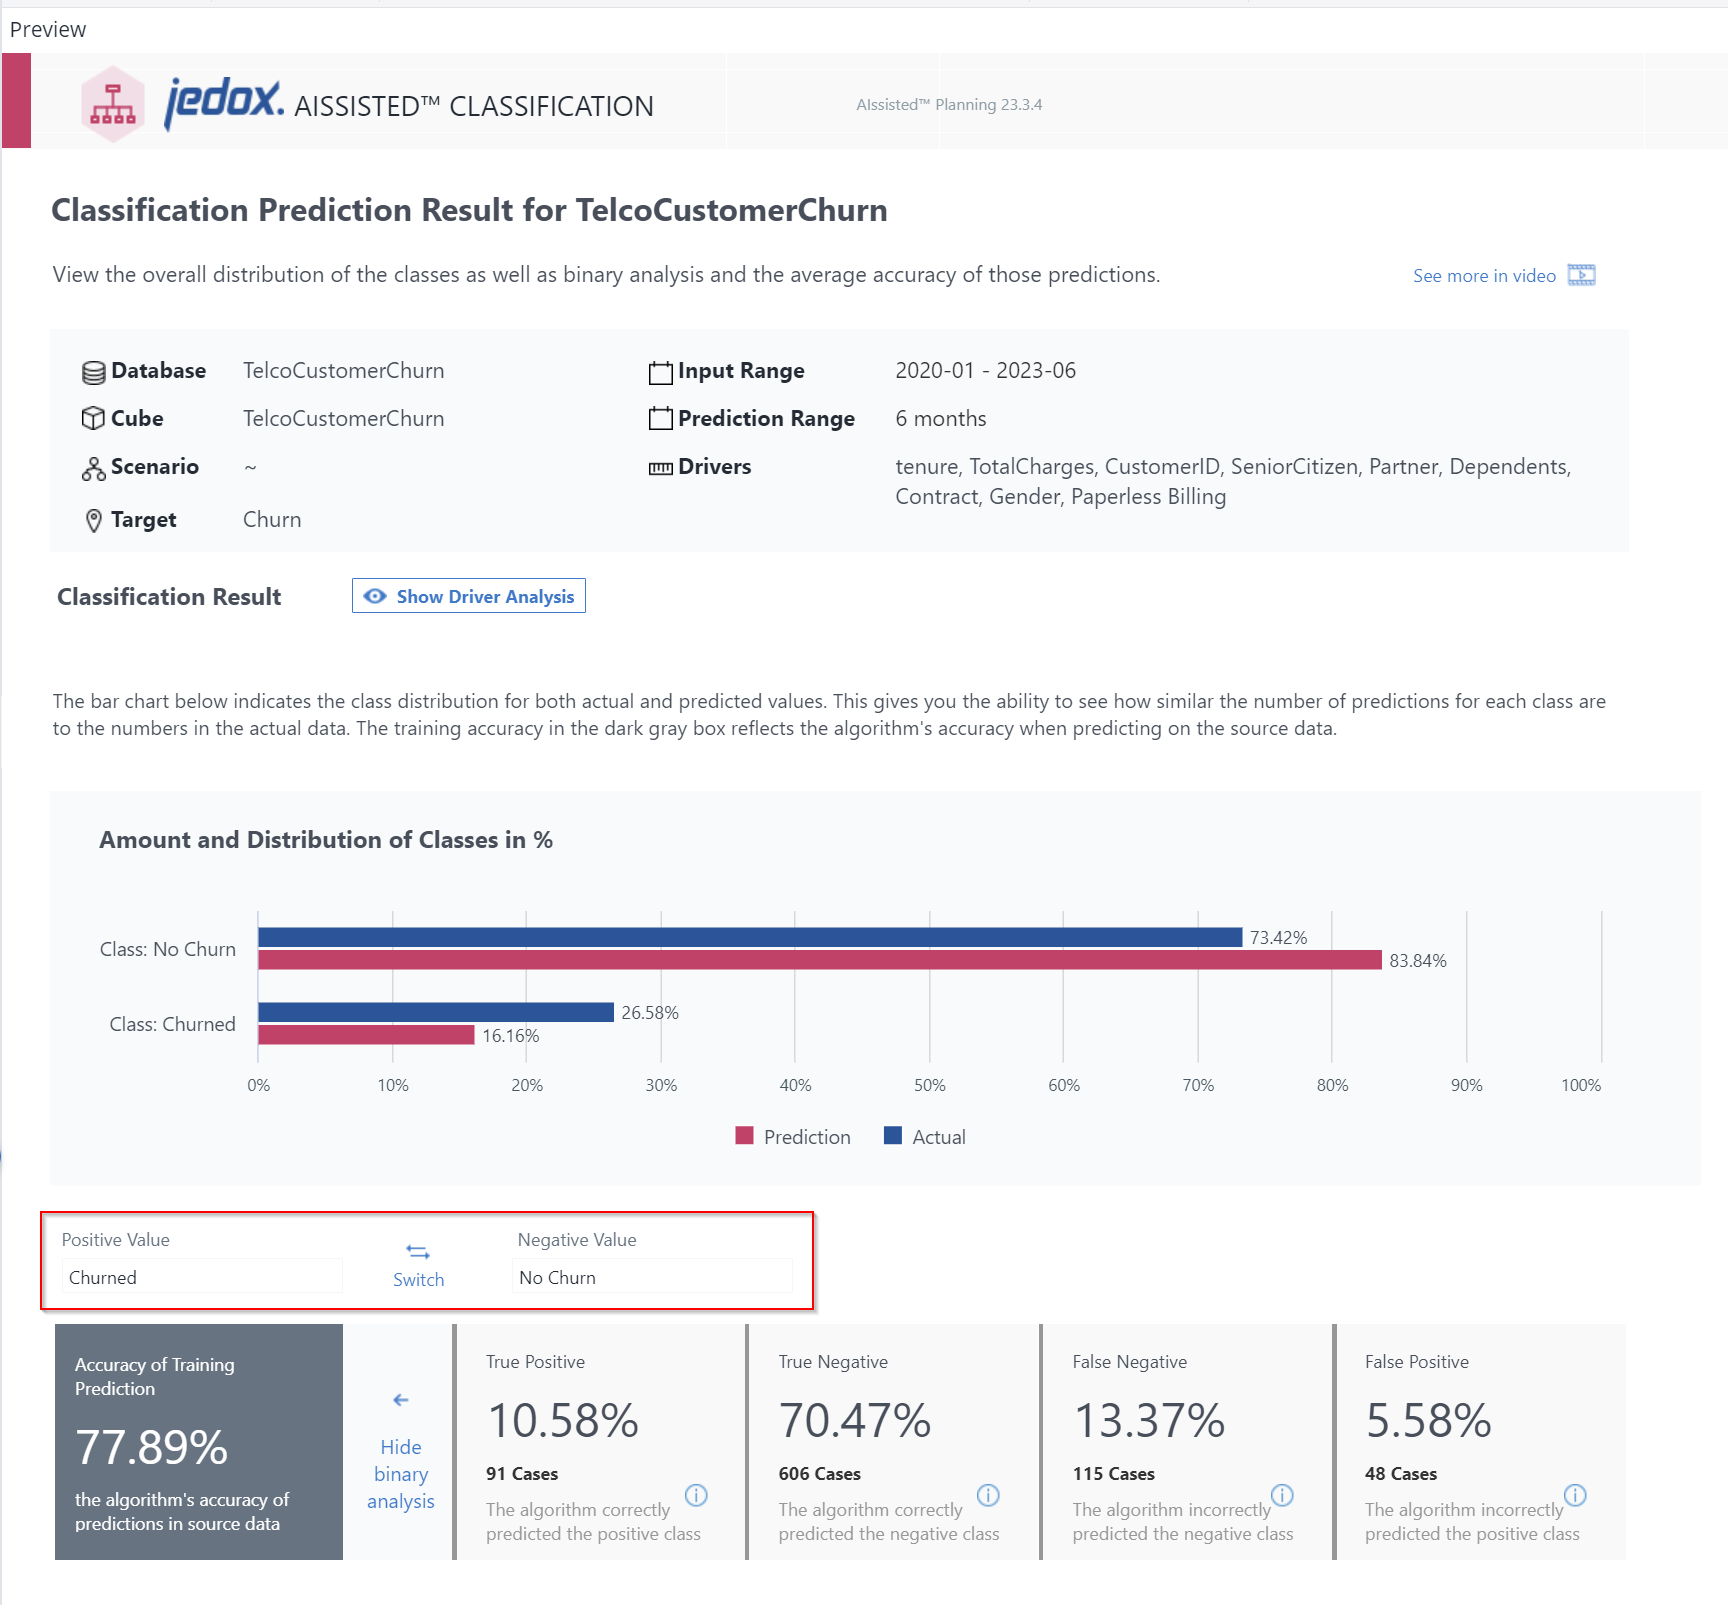
Click on the blue text in the light gray box to access the Binary Analysis, e.g. True Positive, provided that there is source data with which to compare the predictions. This activates the "Switch" button (highlighted on the image below), allowing you to choose which values should be seen as positive or negative, depending on the outcome to achieve / avoid.
If data isn't available but you would like to see the analysis, go back to Step 2 in the setup and change your time range. For instance, if you have data of the past 3 years, change it to use the past 2.5 years as source data, and predict 6 months to compare with known values.
Result Report for Multi-class Classification
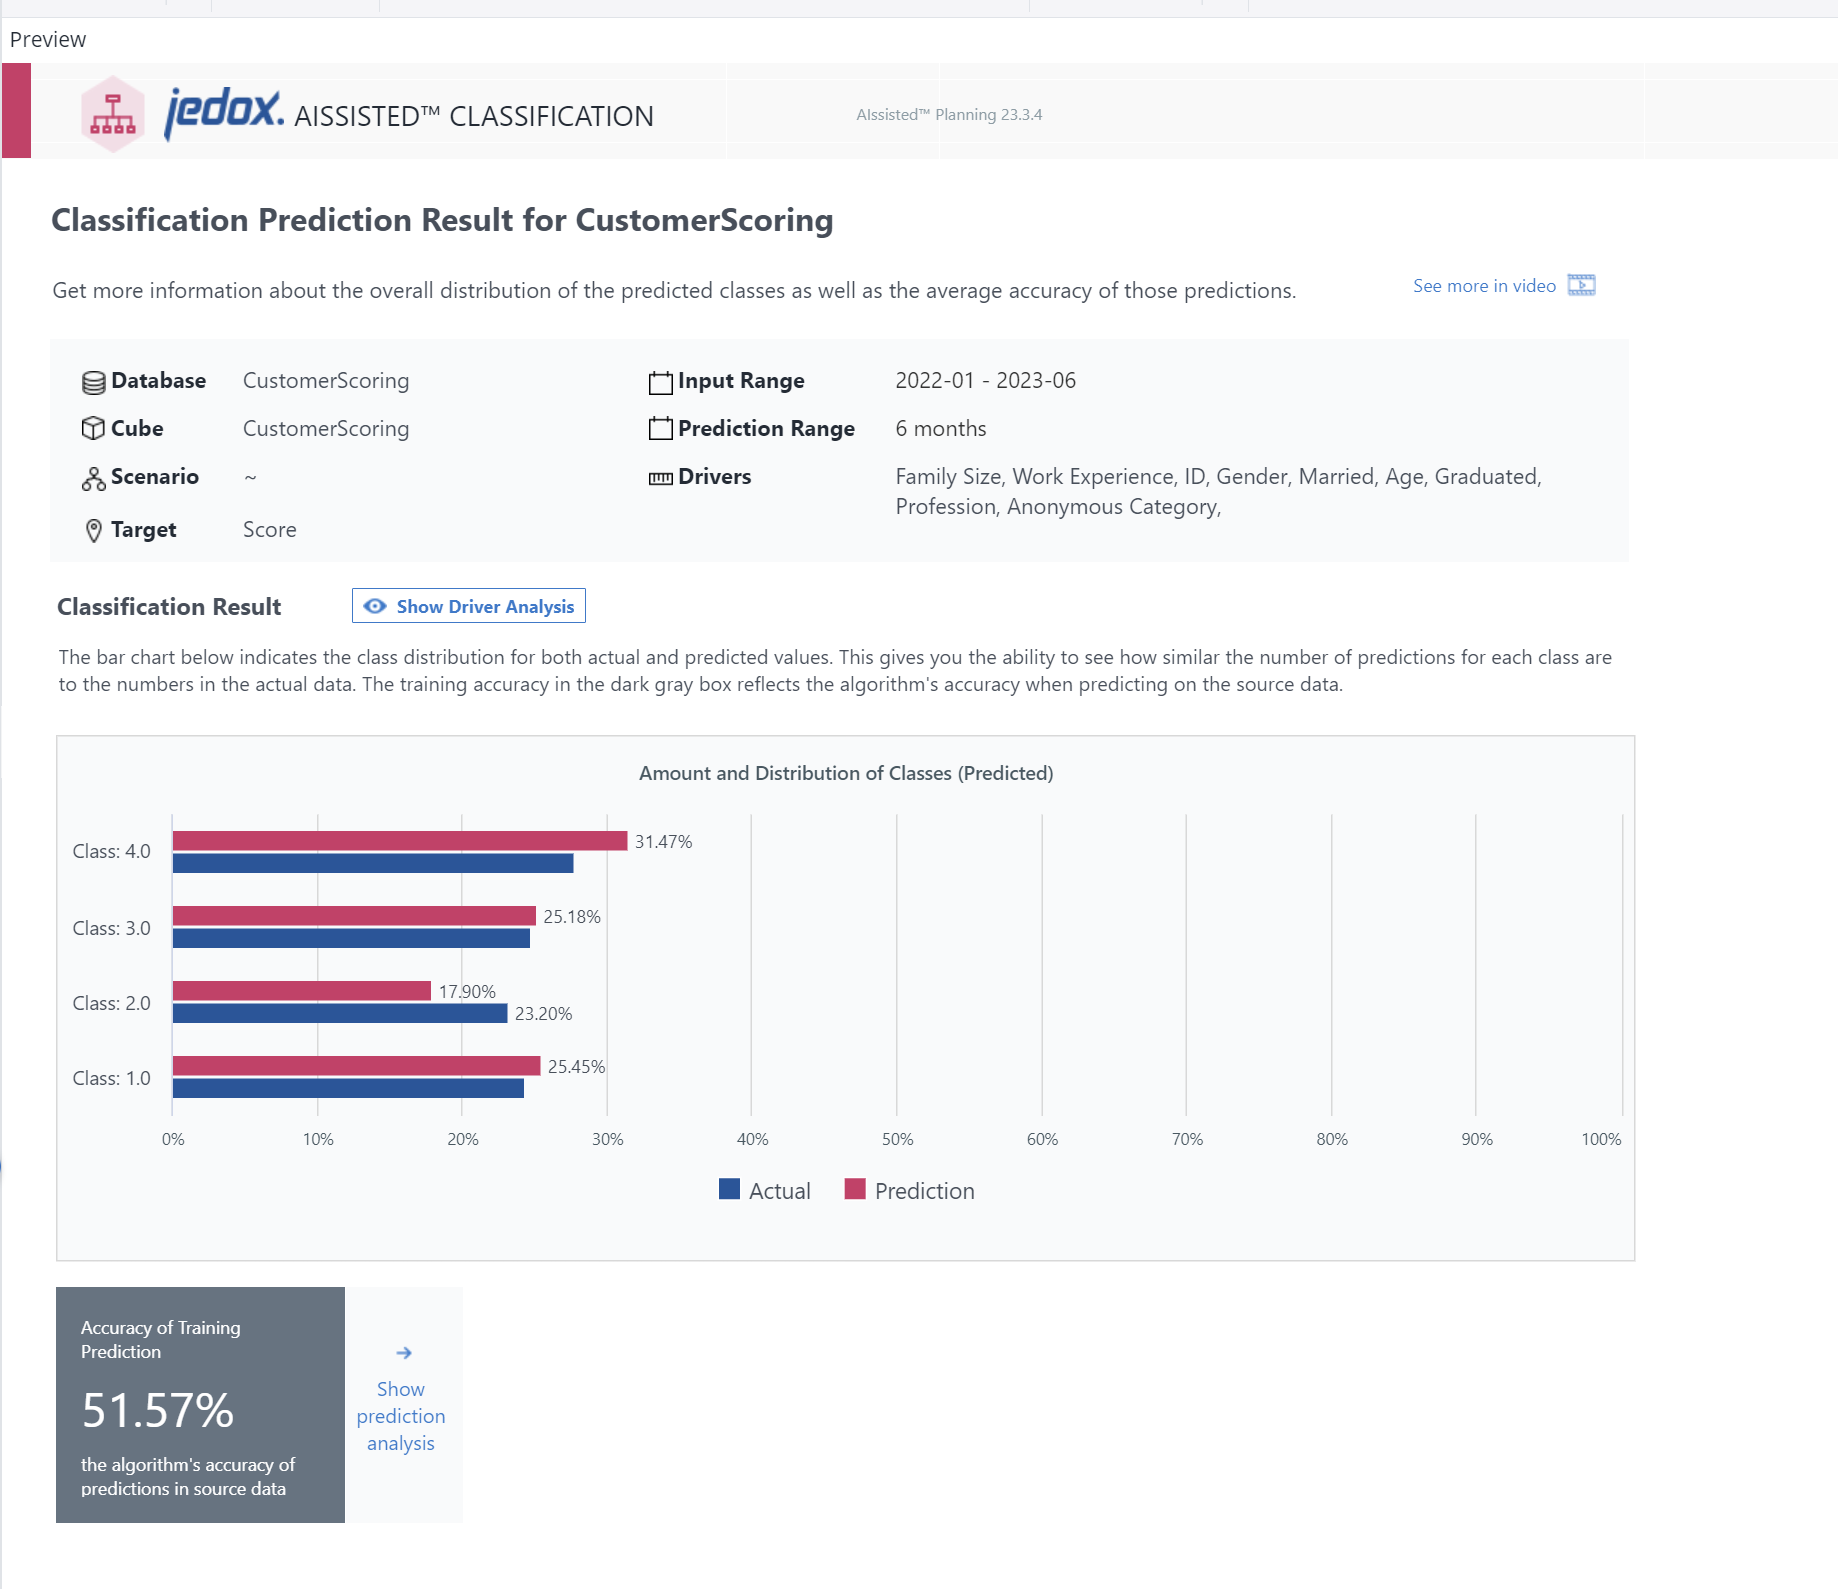
The bar chart which opens the section indicates the class distribution in percentage for both actual and predicted values. Hover over the bars or over the Actual and Prediction chart key elements to highlight them.
The training accuracy in the dark gray box below the chart reflects the algorithm's accuracy when comparing predictions to the source data.
Click on the blue text in the light gray box to show the Prediction Analysis, e.g. the number of accurate and inaccurate predictions. These values are created by comparing actual values in your source data to predictions by the Wizard. If there are no actual values for the target range, there will be nothing populated here.
If data isn't available but you would like to see the analysis, go back to Step 2 in the setup and change your time range. For instance, if you have data of the past 3 years, change it to use the past 2.5 years as source data, and predict 6 months to compare with known values.
Adding prediction values to reports
The results of the individual classification task can be found in a version element the user stored them in, and Prediction is the default element. Classification generally happens on a base level, so the values can be found at that level as well. Please see the video for more detail:
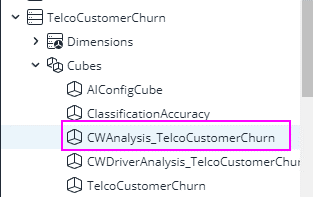
The analysis values for Classification can be found in the user's database and a new cube, called CWAnalysis_UserCubeName, where UserCubeName is whatever cube was used as source data for the classification task.
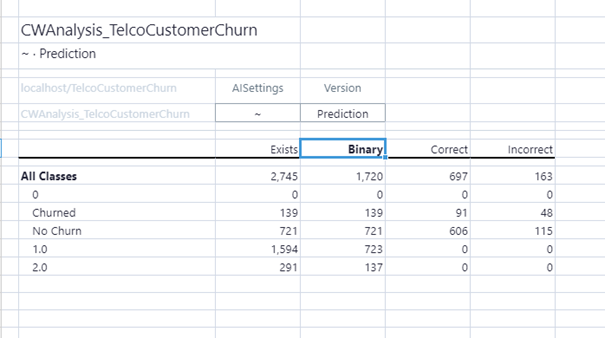
You can view the data through a simple View, with dimensions AISettings and Version in the POV, and Class and ClassificationAnalysis as row and column. Remember that your AISettings should be whatever the scenario name you are working with.
For Actual values, there is the class distribution of the source data. For the Prediction version, you can see class distribution, the number of correct and incorrect values predicted, and, in the case of binary classification, binary analysis. However, this analysis assumes the first element of the class is positive, so be sure that is correct. For example, if the positive class is not the first element, then all analysis should be reverse, e.g. positive negative is then false negative.
Updated July 3, 2025
