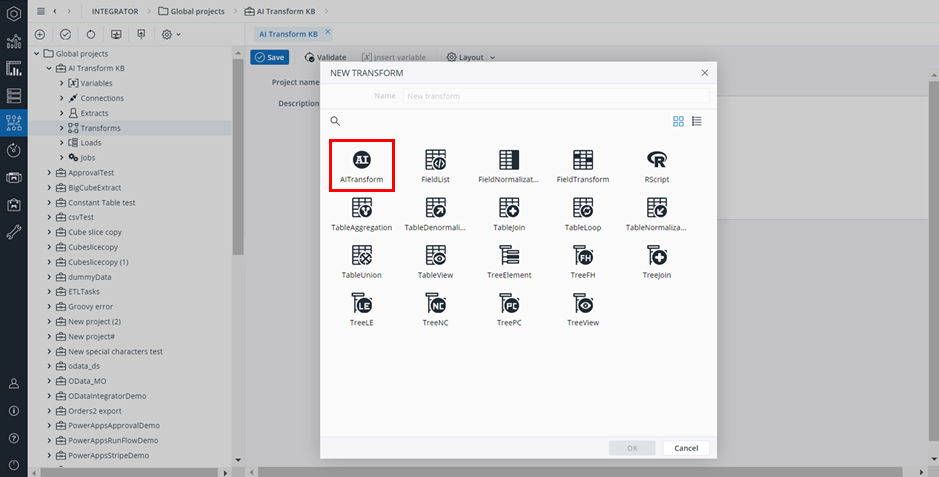
With the AITransform, Jedox Cloud users can use AIssisted™ Planning functionality within Jedox Integrator. This article gives examples using the database from the AIssisted™ Planning Wizard model in the Marketplace. Model installation is not required in order to use the transform, however it may be helpful if you want to follow some of the examples below.
Note: the AITransform is only available through Jedox Cloud, and requires a license. Contact your Jedox Sales representative for more information.
An AITransform Sample ETL project that gives a simple outline of how to use the AITransform is located in the AIssisted™ Planning Wizard, which can be installed from the Jedox Marketplace.
The AITransform has several AIssisted™ Planning functions to choose from. Please select from the following functions below to be directed to the function-specific documentation:
Time Series Forecasting: uses historic data to generate forecasts based on past trends. Allows for a basic interpolation method. Use the AIssistedTimeSeriesPipeline function for more control over interpolation and outlier methods in your time series prediction.
Interpolation: replaces missing values in source data with meaningful values for better results.
Outlier Detection: detects extreme values in source data and replaces them with meaningful values for more accurate forecasts.
AIssistedDataPreparation: manipulates missing values and identifies/replaces outliers based on user input to calculate results.
AIssistedTimeSeriesPipeline: uses outlier detection, interpolation, and extrapolation services based on user input to prepare the data and forecast values.
DriverBasedPrediction: performs basic pre-processing (if required) on input data and trains a regression model for predicting target values.
DriverSelection: performs basic pre-processing (if required) on input data and identifies the important input features with respect to a given target.
Classification: performs basic pre-processing (if required) on input data and trains a classifier for predicting class labels.
DriverSelectionClassification: performs basic pre-processing (if required) on input data and identifies the important input features with respect to a given target. This function can solve classification problems where the goal is to predict the category or class that a data point belongs to, instead of predicting a numerical value, as is the case with standard DriverSelection.
AITransform functions
 Time Series
Choose "TimeSeriesForecasting" in the Function field. This will allow for simple time series forecasting methods with a basic interpolation option. If you would like to have more control over interpolation and outlier methods in your time series prediction, please choose the AIssistedTimeSeriesPipeline function.
Starting with the function field will ensure you see the appropriate fields and parameters to select for each respective function.
Settings
The name of the measures dimension to store the prediction values.
| Input source |
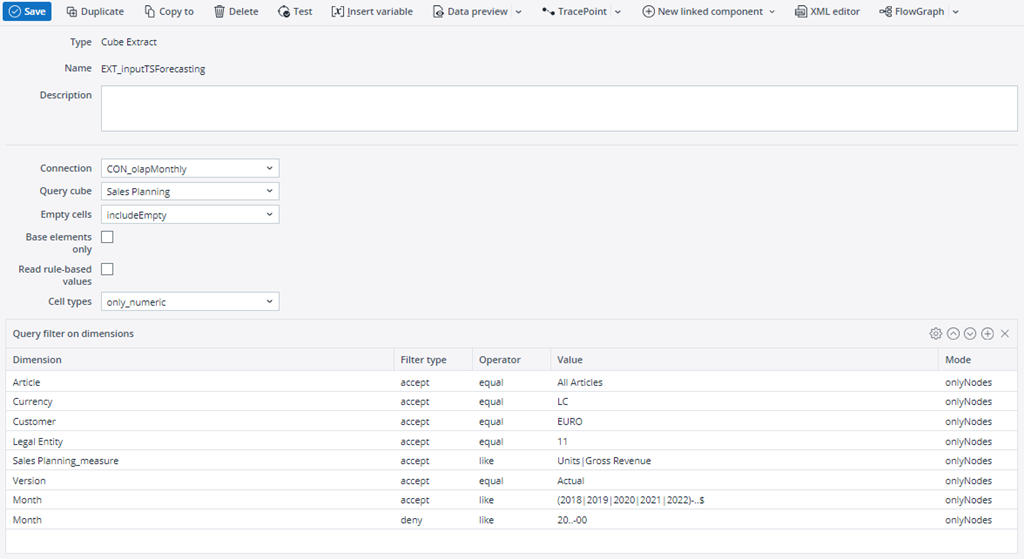
Input source is an extract or transform containing at least Time, Version, and Measures dimensions. Additional dimensions should also be included if they are important to your data structure, so for example, when using a cube extract. The input data should be time series data you would like to base your prediction on, with as few missing values as possible. The time dimension should be structured as either daily, weekly, monthly, or yearly data. The data should be normalized. An example source input cube extract of monthly data for two measures is shown below. Notice the time query that ensures the extract pulls only data monthly data and not, for example a time element like 2020-00. Note: do not use the same source for both input and export, as the input data may be replaced if the transform is followed by a cube load. |
| Time dimension
Version dimension Measures dimension |
The dropdown lists contain column names from the input source. Time, Version, and Measures dimensions can have variable or constant inputs. |
| Values |
The Values column from the time series input source, e.g. #Value. |
| Function | Choose Time Series Forecasting from the list of AI functions. It uses historic data to generate forecasts based on past trends. |
| Period | Input data must have an assigned period, which is defined as a number of data points per period. Period can be Daily (365), Monthly (12), Weekly (52), and Yearly (1). In the example shown above, it would be Monthly. |
| Output source |
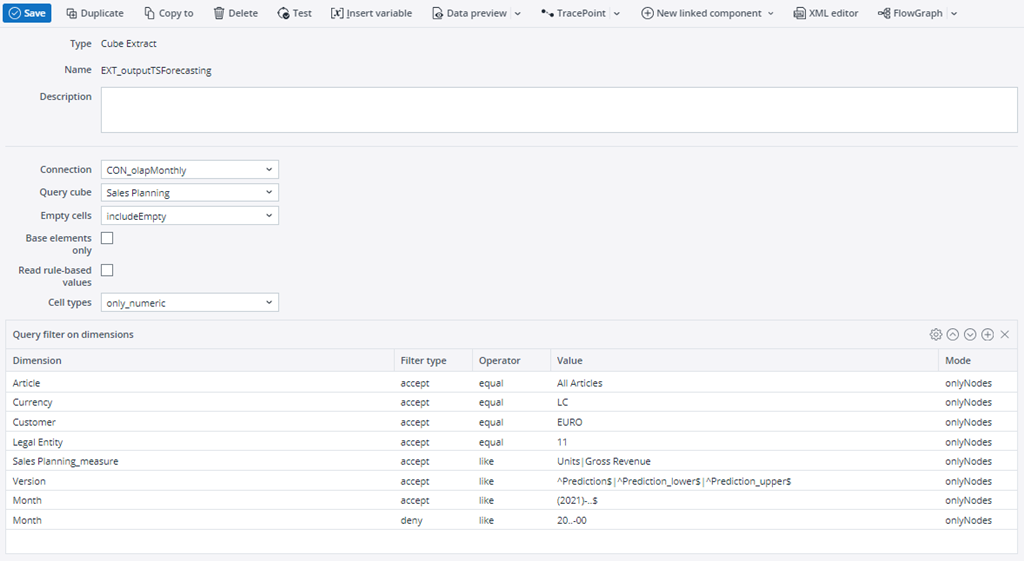
Target extract/transform where the results values are stored. The output source must already exist before the transform is run. The dimension mapping must be similar to that of the Input Source, i.e., containing Measures, Time, and Version dimensions. However, the structure might change, depending on the output type you select in the Parameters. Please see Output Type in the Parameters section below. Below is an example of an output source cube extract that belongs to the Input Source example above. It looks similar to the input, however there are some differences. Output Type 2 is selected in the parameters, which means the Version dimension should have three elements in which to populate the values of predictions, upper bound predictions, and lower bound predictions. The time dimension filter is also different, as the prediction values should be populated into the year in which they belong, in this case 2021. From here you can transform your data as you would like in order to, for example, load it to a cube, join it with other data, or export it to another data source. Note: do not use the input source as an output source, as the input data may be replaced if the transform is followed by a cube load. |
| Output Time dimension | The name of the time dimension where you would like result values stored. |
| Output Version dimension | The name of the version dimension where you would like the result values stored. |
| Output Measures dimension | The name of the measures dimension where you would like the result values stored. |
| Output values | The name of the values column where your result values will be populated, e.g. #Values. |
Parameters - Time Series
The Function parameters are preset by the choices you made in the above Function setting.
| Function Parameter | Description |
| NumberOfPredictions | Sets the number of time units (as set in Period parameter) to predict, i.e. 5 years, 12 months, 180 days, etc. It is preset for monthly input; you can change this in the Period parameter in Settings. |
| AlgorithmType |
The AITransform includes 12 algorithms for data analysis: 1 - Linear Model 2 - Holt Winter 3 - Seasonal Naïve 4 - Exponential Smoothing 5 - ARIMA 6 - Random Walk with Drift 7 - Seasonal and Trend Decomposition using Loess (STL) model 8 - generalized STL model 9 - Neural Network Time Series Forecast 10 - TBATs model 11 - Croston's Method 12 - Extrapolation (note that extrapolation is not AI or Machine Learning) If "all" or "0" is entered, then all algorithms will run and the most accurate will be chosen for result. Enter 1-12 to select a particular algorithm. Multiple algorithms can be entered with comma separation, e.g. "1,3,5". The most accurate of the selected algorithms will be chosen for the result. |
| AccuracyThreshold | Minimum percentage of training accuracy required from the algorithms in order to return values, e.g. 40 = 40% accuracy must be met or no values will be returned. |
| UseInterpolation |
True: zero or null values in the source data will be replaced with meaningful values before predictions are calculated. False: zero or null values will be included in the source data sent to the algorithms. |
| PercentageOfZeros | Percentage of zero/null data that will be tolerated. When the threshold is reached, an error message appears ("one or more time series has more than x% zeros"). |
 Interpolation
This function replaces missing values in source data with meaningful values for better results. Choose "Interpolation" in the Function field. Starting with the function field will ensure you see the appropriate fields and parameters to select for each respective function.
Settings
| Input source |
Input source is an extract/transform containing Time, Version, and Measures dimensions. Additional dimensions should also be included if they are important to your data structure, so for example, when using a cube extract. The input data should be the entire time series data you would like to have analyzed to find missing values and have a replacement suggested. The time dimension should be structured as either daily, weekly, monthly, or yearly data. The data should be normalized. An example source input cube extract of monthly data for one measure is shown below. Notice the time query that ensures the extract pulls only data monthly data and not, for example a time element like 2020-00. From here you can transform your data as you would like in order to, for example, load it to a cube, join it with other data or export it to another data source. Note: do not use the same source for both input and export, as the input data may be replaced if the transform is followed by a cube load. |
| Time dimension
Version dimension Measures dimension |
The dropdown lists contain column names from the input source. Time, Version, and Measures dimensions can have variable or constant inputs. |
| Values |
The Values column from the time series input source, e.g. #Value. |
| Function | Interpolation: replaces missing values in source data with meaningful values for better results. |
| Period | Input data must have an assigned period, which is defined as a number of data points per period. Period can be Daily (365), Monthly (12), Weekly (52), and Yearly(1). In the example shown above, it would be Monthly. |
| Output source |
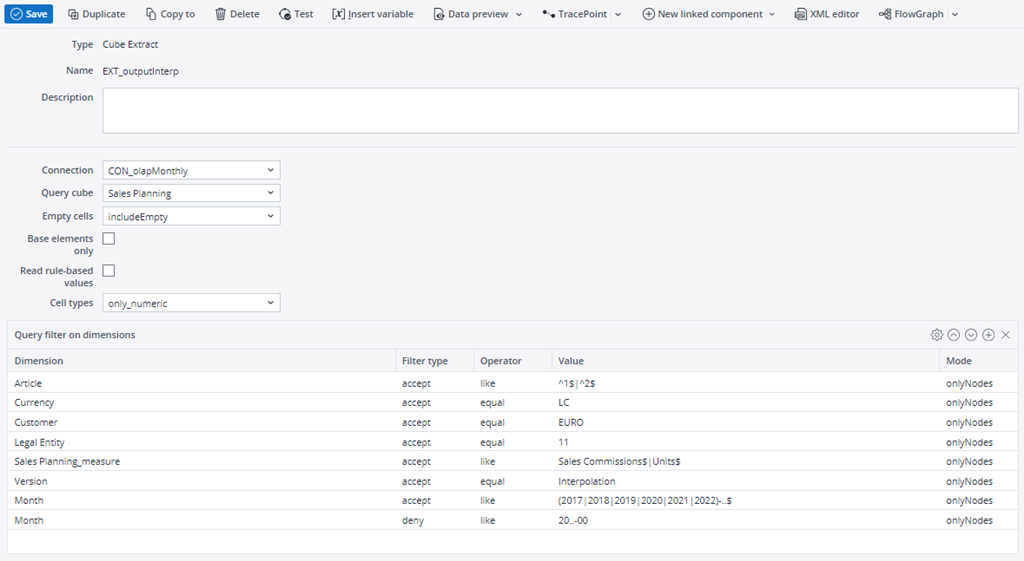
Target extract/transform where the results values are stored. The output source must already exist before the transform is run. The dimension mapping must be similar to that of the Input Source, i.e., containing Measures, Time, and Version dimensions. The only change should be in the Version element name where the interpolated values should be stored, e.g. Interpolation instead of Actual. Below is an example of an output source cube extract that belongs to the Input Source example above. Note: do not use the input source as an output source, as the input data may be replaced if the transform is followed by a cube load. Also, Input Source and Output Source must have the same number of rows. |
| Output Time dimension | The name of the time dimension where you would like result values stored. |
| Output Version dimension | The name of the version dimension where you would like the result values stored. |
| Output Measures dimension | The name of the measures dimension where you would like the result values stored. |
| Output values | The name of the values column where your result values will be populated. |
Parameters - Interpolation
The Function parameters are preset by the choices you made in the above setting. If you would like to make changes, however, here are the possible inputs.
 OutlierTS
This function detects extreme values in source data and replaces them with meaningful values for more accurate forecasts.
Choose "OutlierTS" in the Function field. Starting with the function field will ensure you see the appropriate fields and parameters to select for each respective function.
Settings
| Input source |
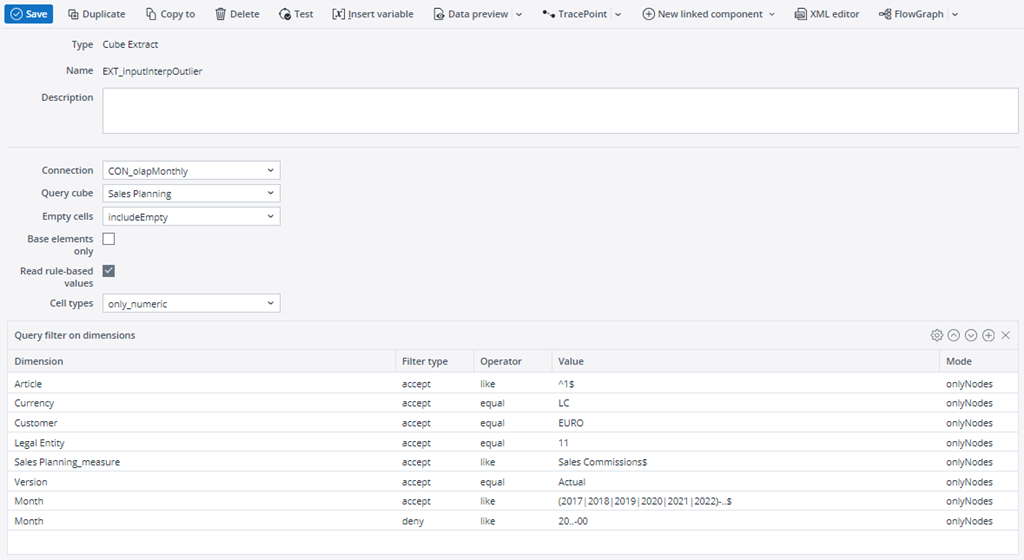
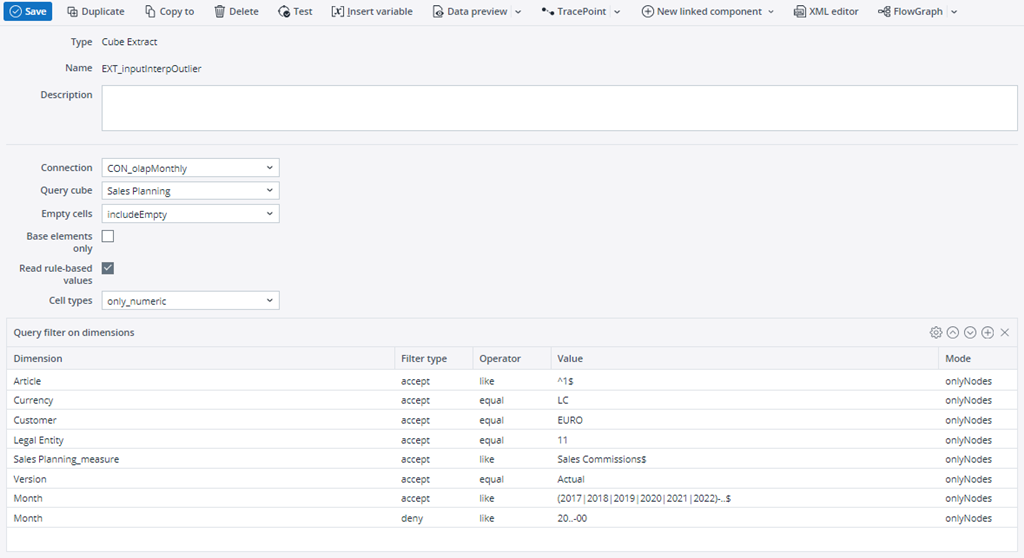
Input source is an extract/transform containing Time, Version, and Measures dimensions. Additional dimensions should also be included if they are important to your data structure, so for example, when using a cube extract. The input data should be the entire time series data you would like to have analyzed to find missing values and have a replacement suggested. The time dimension should be structured as either daily, weekly, monthly, or yearly data. The data should be normalized. An example source input cube extract of monthly data for one measure is shown below. Notice the time query that ensures the extract pulls only data monthly data and not, for example a time element like 2020-00. Note: do not use the same source for both input and export, as the input data may be replaced if the transform is followed by a cube load. |
| Time dimension
Version dimension Measures dimension |
The dropdown lists contain column names from the input source. Time, Version, and Measures dimensions can have variable or constant inputs. |
| Values |
The Values column from the time series input source, e.g. #Value. |
| Function | Outlier Detection: detects extreme values in source data and replaces them with meaningful values for more accurate forecasts. |
| Period | Input data must have an assigned period, which is defined as a number of data points per period. Period can be Daily (365), Monthly (12), Weekly (52), and Yearly(1). |
| Output source |
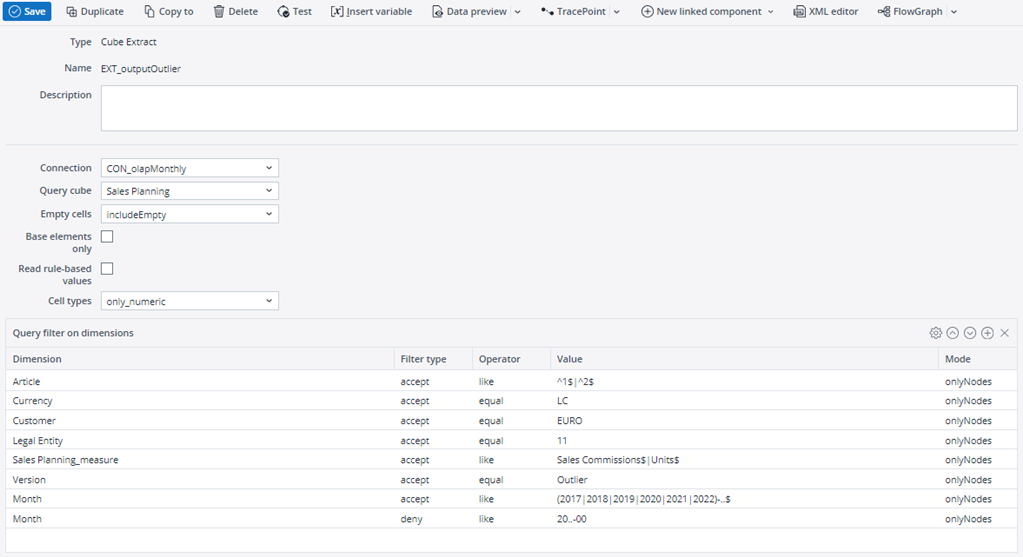
Target extract/transform where the results values are stored. The output source must already exist before the transform is run. The dimension mapping must be similar to that of the Input Source, i.e., containing Measures, Time, and Version dimensions. The only change should be in the Version element name where the interpolated values should be stored, e.g. Outlier instead of Actual. Below is an example of an output source cube extract that belongs to the Input Source example above. From here you can transform your data as you would like in order to, for example, load it to a cube, join it with other data or export it to another data source. Note: do not use the input source as an output source, as the input data may be replaced if the transform is followed by a cube load. Also, Input Source and Output Source must have the same number of rows. |
| Output Time dimension | The name of the time dimension where you would like result values stored. |
| Output Version dimension | The name of the version dimension where you would like the result values stored. |
| Output Measures dimension | The name of the measures dimension where you would like the result values stored. |
| Output values | The name of the values column where your result values will be populated. |
Parameters - OutlierTS
The Function parameters are preset by the choices you made in the above setting.
| AlgorithmType | Algorithms available for Outlier detection:
|
||||||||||||||||||
| UseInterpolation | Generate replacement values for detected outliers (recommended to use 0 or 1).
|
||||||||||||||||||
| AlgGroup | Same as AlgGroup parameter in Interpolation. | ||||||||||||||||||
| AlgInterpolate | Same as AlgorithmType in Interpolation. | ||||||||||||||||||
| AlgSubType | Same as AlgSubType in Interpolation. | ||||||||||||||||||
| FailSafe | Outlier detection algorithms are highly data-dependent, so all algorithms may not work for all kinds of data. This option decides the fall back in case the algorithm selected by the user fails.
|
 AIssistedDataPreparation
This function offers suggestions for missing values and identifies/replaces outliers based on user input to calculate results.
Choose "AIssistedDataPreparation" in the Function field. Starting with the function field will ensure you see the appropriate fields and parameters to select for each respective function.
Settings
| Input source |
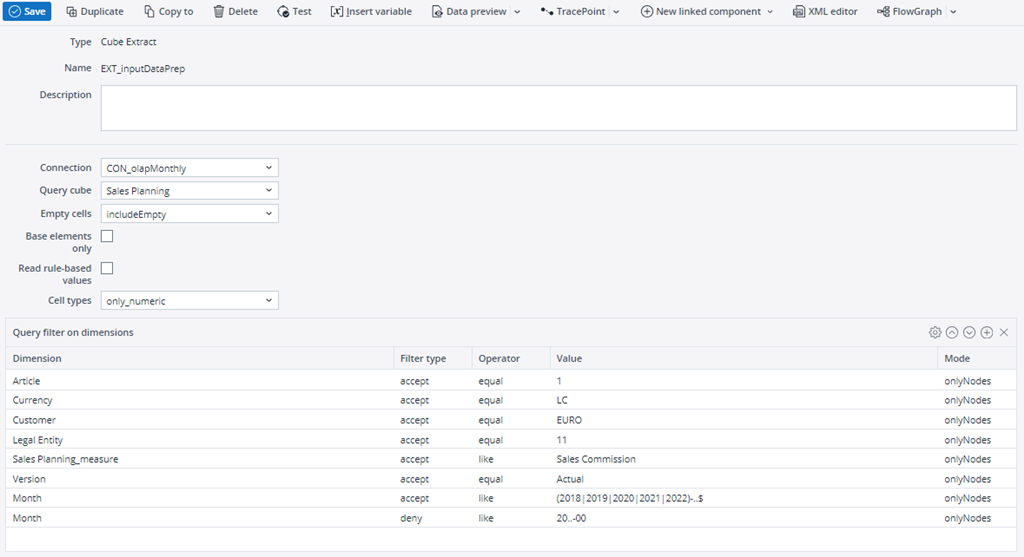
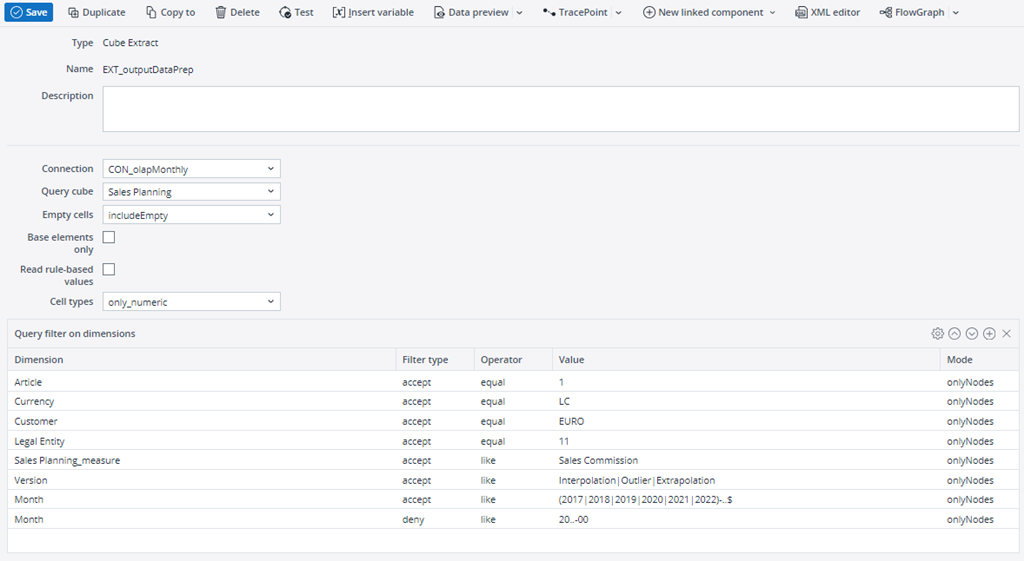
Input source is an extract/transform containing Time, Version, and Measures dimensions. Additional dimensions should also be included if they are important to your data structure, so for example, when using a cube extract. The input data should be the entire time series data you would like to have analyzed. The time dimension should be structured as either daily, weekly, monthly, or yearly data. The data should be normalized. An example source input cube extract of monthly data for one measure is shown below. Notice the time query that ensures the extract pulls only data monthly data and not, for example a time element like 2020-00. Note: do not use the same source for both input and export, as the input data may be replaced if the transform is followed by a cube load. |
| Time dimension
Version dimension Measures dimension |
The dropdown lists contain column names from the input source. Time, Version, and Measures dimensions can have variable or constant inputs. |
| Values |
The Values column from the time series input source, e.g. #Value. |
| Function | AIssistedDataPreparation: manipulates missing values and identifies/replaces outliers based on user input to calculate results. |
| Period | Input data must have an assigned period, which is defined as a number of data points per period. Period can be Daily (365), Monthly (12), Weekly (52), and Yearly(1). |
| Output source |
The dimension mapping must be similar to that of the Input Source, i.e., containing Measures, Time, and Version dimensions. However, the structure might change, depending on the output type you select in the Parameters. Please see Output Type in the Parameters section below. Below is an example of an output source cube extract that belongs to the Input Source example above. It looks similar to the input, however there are some differences. Output Type “all” was selected in the parameters, which means the Version dimension should have three elements in which to populate the values of Outlier, Interpolation and Extrapolation. Depending on the output type, the output source will change. From here you can transform your data as you would like in order to, for example, load it to a cube, join it with other data or export it to another data source. Note: do not use the input source as an output source, as the input data may be replaced if the transform is followed by a cube load. |
| Output Time dimension | The name of the time dimension where you would like result values stored. |
| Output Version dimension | The name of the version dimension where you would like the result values stored. |
| Output Measures dimension | The name of the measures dimension where you would like the result values stored. |
| Output values | The name of the values column where your result values will be populated. |
Parameters - AIssistedDataPreparation
The Function parameters are preset by the choices you made in the above setting.
| Tasks | Defines the data preparation task to be performed.
Notes Oie, oi, oe, io, ie, ei, eo are performed sequentially (the output of one method is used as input for the next).If the task value is "all", then three times as many rows are needed for the output as the input has. The output needs to include the three result version element names, which are "Interpolation", "Outlier", and "Extrapolation". For all other task values (e.g. oie, oi, ei, i, etc.), the output can have the same number of rows as the input, and the output should only have one version element name. |
||||||||||||||||||||||
| AlgorithmOutlier | The algorithm to be used for outlier detection. For details see the OutlierTS service. | ||||||||||||||||||||||
| FailSafe | Outlier detection algorithms are highly data-dependent, so all algorithms may not work for all kinds of data. This option decides the fall back in case the algorithm selected by the user fails.
|
||||||||||||||||||||||
| AlgorithmInterpolate | Same as AlgorithmType in Interpolation. | ||||||||||||||||||||||
| AlgorithmExtrapolate | The algorithm to be used for extrapolation:
|
 AIssistedTimeSeriesPipeline
Choose "AIssistedTimeSeriesPipeline" in the Function field. This function allows more control over interpolation and outlier methods in your time series prediction. For simple time series forecasting methods with a basic interpolation option, please choose the TimeSeries function.
Starting with the function field will ensure you see the appropriate fields and parameters to select for each respective function.
Settings
| Input source |
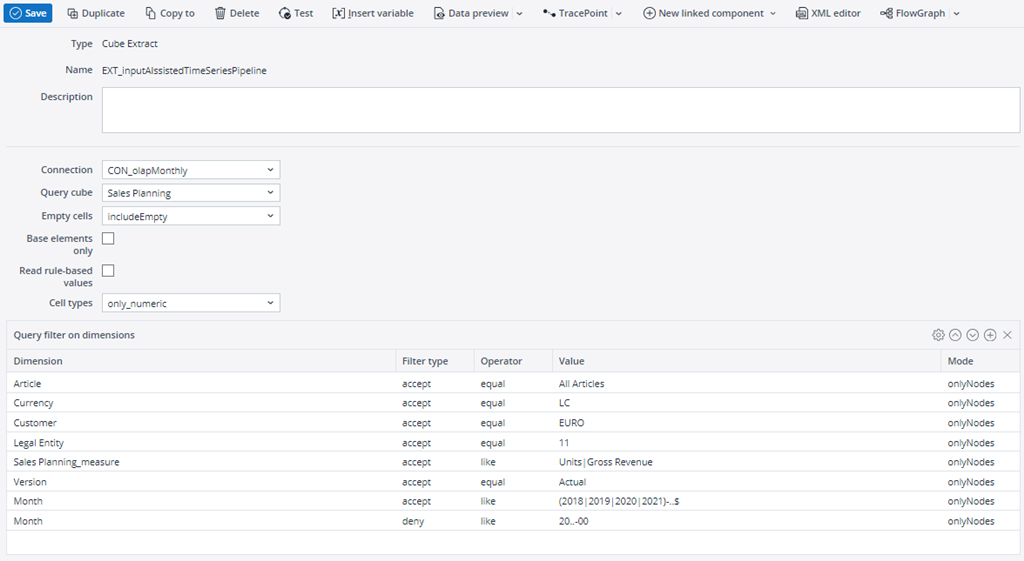
Input source is an extract or transform containing at least Time, Version, and Measures dimensions. Additional dimensions should also be included if they are important to your data structure, so for example, when using a cube extract. The input data should be time series data you would like to base your prediction on, with as few missing values as possible, although the service will forecast using interpolated values. The time dimension should be structured as either daily, weekly, monthly, or yearly data. The data should be normalized. An example source input cube extract of monthly data for two measures is shown below. Notice the time query that ensures the extract pulls only data monthly data and not, for example a time element like 2020-00. Note: do not use the same source for both input and export, as the input data may be replaced if the transform is followed by a cube load. |
| Time dimension
Version dimension Measures dimension |
The dropdown lists contain column names from the input source. Time, Version, and Measures dimensions can have variable or constant inputs. |
| Values |
The Values column from the time series input source, e.g. #Value. |
| Function | AIssistedTimeSeriesPipelineInput: uses outlier detection, interpolation, and extrapolation services based on user input to prepare data and then forecast values. |
| Period | Input data must have an assigned period, which is defined as a number of data points per period. Period can be Daily (365), Monthly (12), Weekly (52), and Yearly(1). In the example shown above, it would be Monthly. |
| Output source |
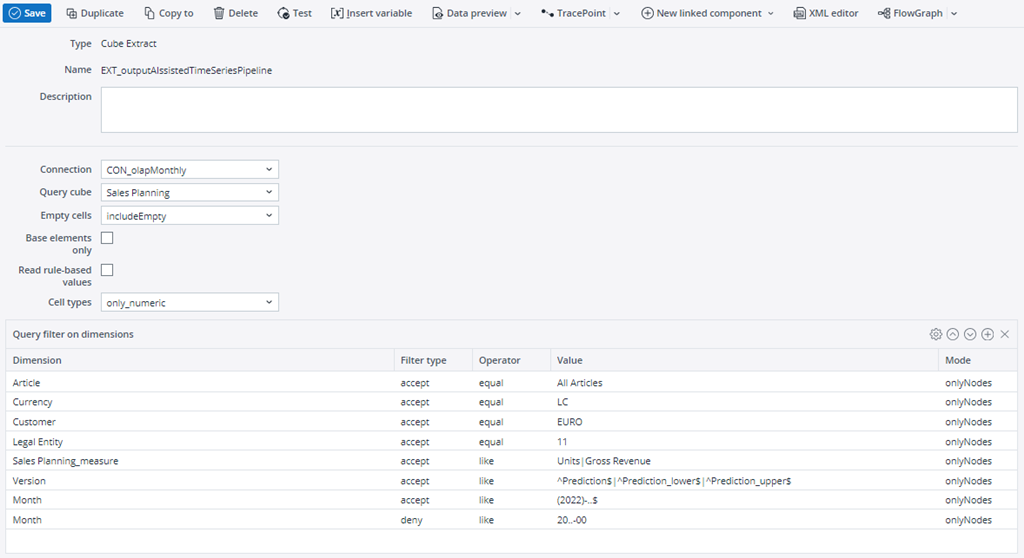
Target extract/transform where the results values are stored. The output source must already exist before the transform is run. The dimension mapping must be similar to that of the Input Source, i.e., containing Measures, Time, and Version dimensions. Below is an example of an output source cube extract that belongs to the Input Source example above. It looks similar to the input to the input, however there are some differences. The Version dimension should have three elements in which to populate the values of predictions, upper bound predictions and lower bound predictions. The time dimension filter is also different, as the prediction values should be populated into the year in which they belong, in this case 2022. From here you can transform your data as you would like in order to, for example, load it to a cube, join it with other data or export it to another data source. Note: do not use the input source as an output source, as the input data may be replaced if the transform is followed by a cube load. |
| Output Time dimension | The name of the time dimension where you would like result values stored. |
| Output Version dimension | The name of the version dimension where you would like the result values stored. |
| Output Measures dimension | The name of the measures dimension where you would like the result values stored. |
| Output values | The name of the values column where your result values will be populated, e.g. #Values. |
Parameters - AIssistedTimeSeriesPipeline
The Function parameters are preset by the choices you made in the above setting.
| NumberOfPredictions | Sets the number of time units (as set in Period parameter) to predict, i.e. 5 years, 12 months, 180 days, etc. It is preset for monthly input; you can change this in the Period parameter in Settings. | ||||||||||||||||||||||
| AlgorithmType | The AITransform includes 12 algorithms for data analysis:
1 - Linear Model If "all" or "0" is entered, then all algorithms will run and the most accurate will be chosen for result. Enter 1-12 to select a particular algorithm. Multiple algorithms can be entered with comma separation, e.g. "1,3,5". The most accurate of the selected algorithms will be chosen for the result. |
||||||||||||||||||||||
| AccuracyThreshold | Minimum percentage of training accuracy required from the algorithms in order to return values, e.g. 40 = 40% accuracy must be met or no values will be returned. | ||||||||||||||||||||||
| PercentageOfZeros | Percentage of zero/null data that will be tolerated. When the threshold is reached, an error message appears ("one or more time series has more than x% zeros"). | ||||||||||||||||||||||
| NumberOfTestValues | The number of rows to be taken as test set for each time series. The value of this parameter must be zero and should not be changed. | ||||||||||||||||||||||
| DataPreparationTask | Defines the data preparation task to be performed.
Note: oie, oi, oe, io, ie, ei, eo are performed sequentially (the output of one method is used as input for the next). |
||||||||||||||||||||||
| AlgorithmOutlier | The algorithm to be used for outlier detection. For details see the OutlierTS service. | ||||||||||||||||||||||
| FailSafe | Outlier detection algorithms are highly data-dependent, so all algorithms may not work for all kinds of data. This option decides the fall back in case the algorithm selected by the user fails.
|
||||||||||||||||||||||
| AlgorithmInterpolate | Same as AlgorithmType in Interpolation. | ||||||||||||||||||||||
| AlgorithmExtrapolate | The algorithm to be used for extrapolation:
|
 DriverBasedPrediction
This function performs basic pre-processing (if required) on input data and trains a regression model for predicting target values. It is often the second type of prediction used if time series prediction doesn’t produce accurate results.
Choose "DriverBasedPrediction" in the Function field. Starting with the function field will ensure you see the appropriate fields and parameters to select for each respective function.
Settings
| Input source |
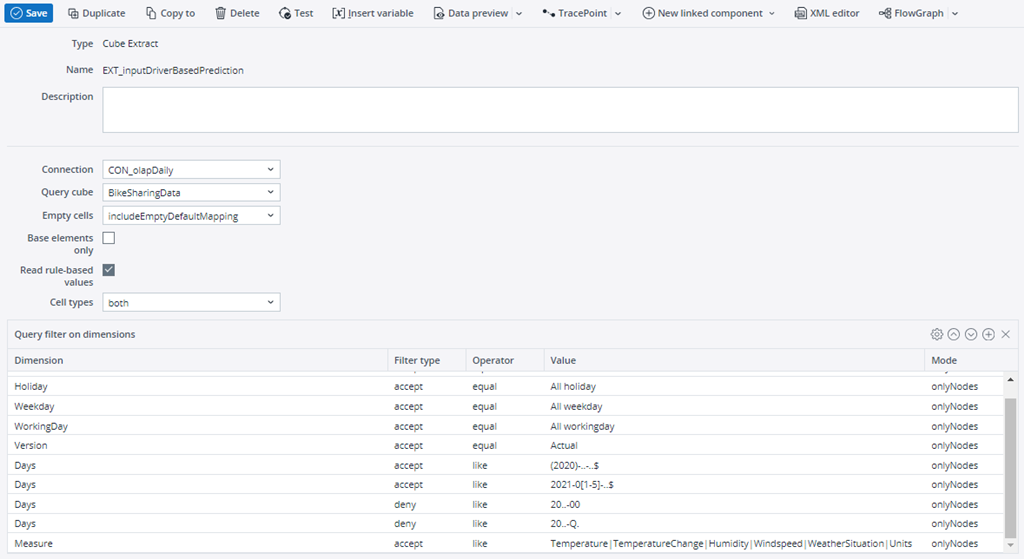
Input source is an extract or transform containing at least Time, Version, and Measures dimensions. Additional dimensions should also be included if they are important to your data structure, so for example, when using a cube extract. The input data should be data you would like to base your prediction on, with as few missing values as possible. The time dimension should be structured as either daily, weekly, monthly, or yearly data. The data should be normalized. An example source input cube extract of daily data for several measures is shown below. All drivers, including the target measure you want to predict should be in this source data. If you are unsure which drivers to choose, try using DriverSelection. Notice that other dimensions are listed in the query filters as well, most notably the time dimension queries. In this example, this ensures that the source data is passed as daily data, and not quarterly. Note: do not use the same source for both input and export, as the input data may be replaced if the transform is followed by a cube load. |
| Time dimension
Version dimension Measures dimension |
The dropdown lists contain column names from the input source. Time, Version, and Measures dimensions can have variable or constant inputs. |
| Values |
The Values column from the time series input source, e.g. #Value. |
| Function | DriverBasedPrediction: performs basic pre-processing (if required) on input data and trains a regression model for predicting target values. |
| Period | Input data must have an assigned period, which is defined as a number of data points per period. Period can be Daily (365), Monthly (12), Weekly (52), and Yearly(1). The example above is daily. |
| Output source |
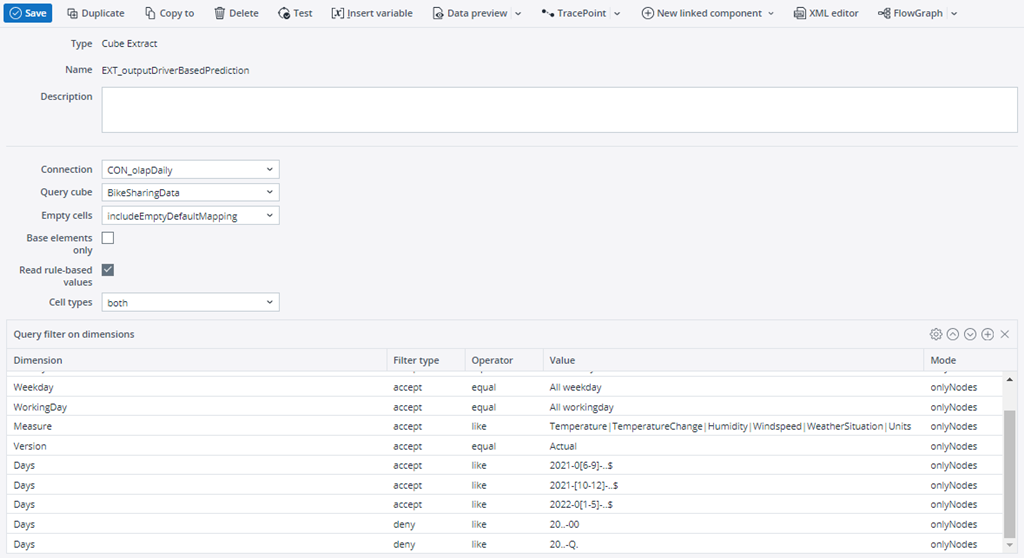
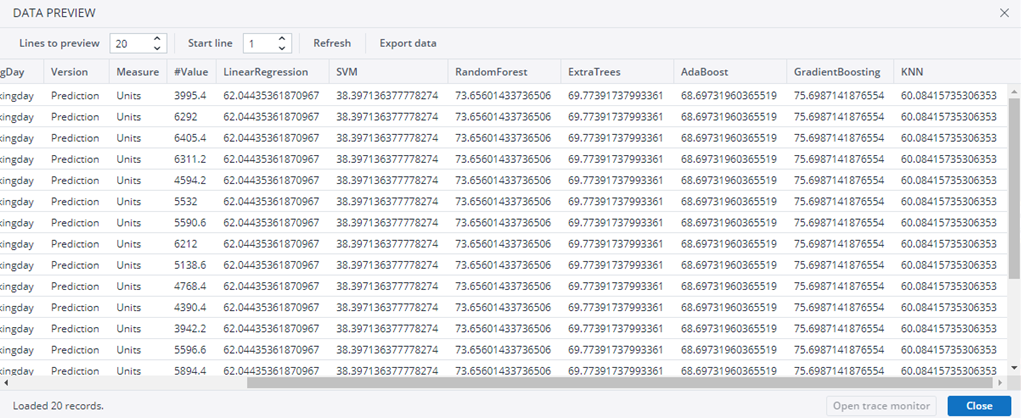
Target extract/transform where the results values are stored. The output source must already exist before the transform is run. The dimension mapping must be similar to that of the Input Source, i.e., containing Measures, Time, and Version dimensions. Below is an example of an output source cube extract that belongs to the Input Source example above. All drivers, including the target measure you want to predict should also be included this output source data. Note: In order to get meaningful predictions for your target measure, you must have values for all other drivers in this output source. Without these values, the prediction will likely be useless. From here you can transform your data as you would like in order to, for example, load it to a cube, join it with other data or export it to another data source. Aside from the prediction values, the transform will also give accuracy values for each algorithm used. See the Data Preview example below. Note: do not use the input source as an output source, as the input data may be replaced if the transform is followed by a cube load. |
| Output Time dimension | The name of the time dimension where you would like result values stored. |
| Output Version dimension | The name of the version dimension where you would like the result values stored. |
| Output Measures dimension | The name of the measures dimension where you would like the result values stored. |
| Output values | The name of the values column where your result values will be populated, e.g. #Value. |
Parameters - DriverBasedPrediction
The Function parameters are preset by the choices you made in the above setting.
| Function Parameter |
Description | ||||||||||||||||
| AlgorithmType |
|
||||||||||||||||
| OptimizeParameters | 0 | ||||||||||||||||
| Normalize | False | ||||||||||||||||
| FixRandomState | True | ||||||||||||||||
| TargetMeasure | Measure to be predicted / dependent measure. In this example, Units. | ||||||||||||||||
| TargetVersion |
Name of element in the Version dimension in which to store the predicted values. In this example, Prediction. |
 DriverSelection
This function performs basic pre-processing (if required) on input data and identifies the important input drivers with respect to a given target.
Choose "DriverSelection" in the Function field. Starting with the function field will ensure you see the appropriate fields and parameters to select for each respective function.
Settings
| Input source |
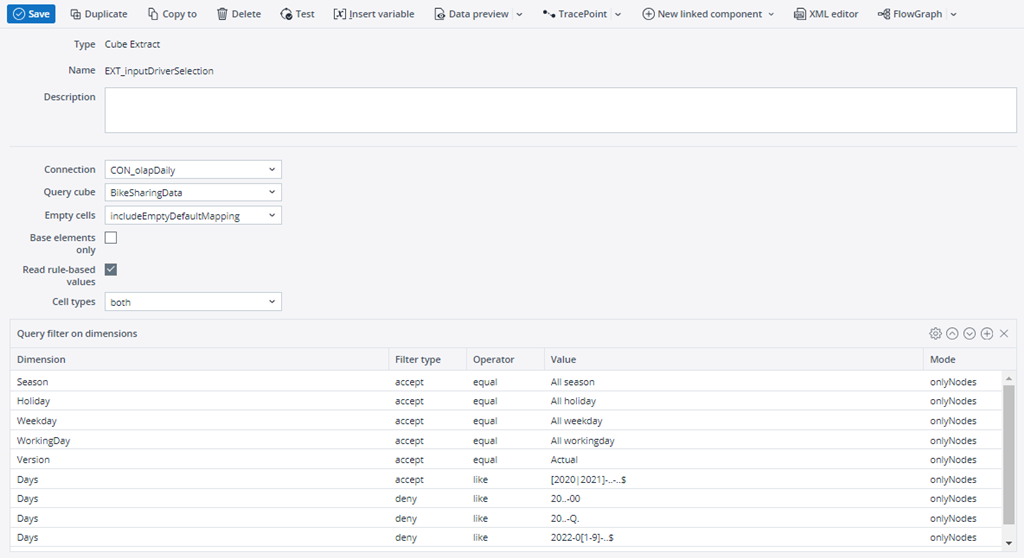
Input source is an extract/transform containing Time, Version, and Measures dimensions. Additional dimensions should also be included if they are important to your data structure, so for example, when using a cube extract. An example source input cube extract of daily data for all measures is shown below. Notice the time query that ensures that the extract pulls only complete data, in this case up until the end of 2021 and does not include quarterly elements. |
| Time dimension
Version dimension Measures dimension |
The dropdown lists contain column names from the input source. Time, Version, and Measures dimensions can have variable or constant inputs. |
| Values |
The Values column from the time series input source, e.g. #Value. |
| Function | DriverSelection: performs basic pre-processing (if required) on input data and identifies the important input features with respect to a given target. |
| Period | Input data must have an assigned period, which is defined as a number of data points per period. Period can be Daily (365), Monthly (12), Weekly (52), and Yearly(1). The above example would be Daily. |
Parameters - DriverSelection
The Function parameters are preset by the choices you made in the above setting.
| Function Parameter | Description | ||||
| AlgorithmType |
|
||||
| Normalize | False | ||||
| FixRandomState | True | ||||
| TargetMeasure | Measure to be analyzed / dependent measure, in this example, Units. |
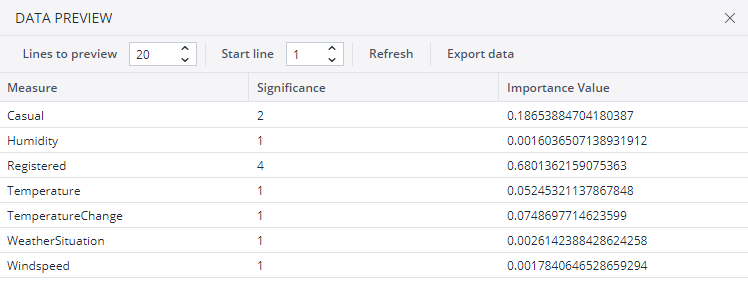
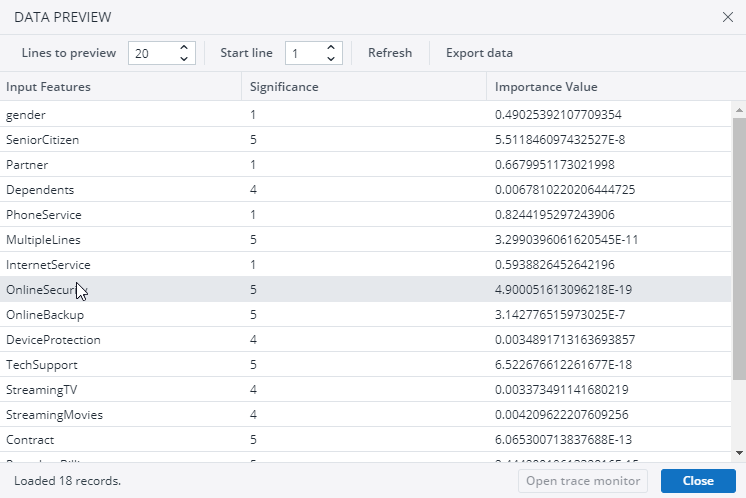
Because there is no output source, from here you can transform your data as you would like in order to, for example, load it to a cube, join it with other data or export it to another data source. Depending on the algorithm type, the output will be different. Below is an example of a Data Preview with the AlgorithmType 3.
This shows the significance level of each feature (the higher the number, the greater the significance of the driver) and the importance values (the closer the driver’s value is to 0, the more important it is).
 Classification
This function performs basic pre-processing (if required) on input data and trains a classifier for predicting class labels. Choose "Classification" in the Function field. Starting with the function field will ensure you see the appropriate fields and parameters to select for each respective function.
Settings
| Input source |
Input source is an extract/transform containing Time (or unique identifier) and Version dimensions. The input for Classification function must be denormalized, so a cube extract on its own will not work. The input source is a denormalized set of data that includes all dimensions and measures that are important to the classification data set as well as values for the target, the class you want to predict, e.g. Churn. Note: do not use the same source for both input and export, as the input data may be replaced if the transform is followed by a cube load. |
| Time dimension
Version dimension Measures dimension |
The dropdown lists contain column names from the input source. Time and Version can have variable or constant inputs. The Time dimension can also be a unique identifier of each row as well, for example CustomerID. |
| Function | Classification: performs basic pre-processing (if required) on input data and trains a classifier for predicting class labels. |
| Output source |
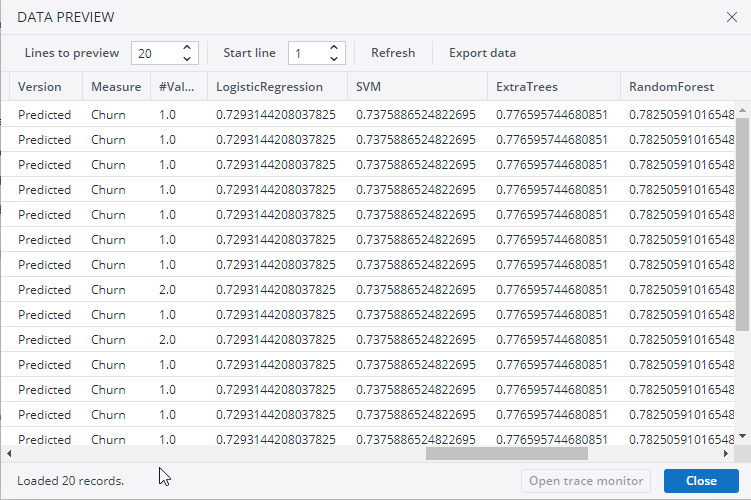
Target extract/transform where the results values are stored. The output source must already exist before the transform is run. The dimension mapping must be similar to that of the Input Source, i.e., containing Time/Unique ID and Version dimensions. The output source for Classification function must also be denormalized. From here you can transform your data as you would like in order to, for example, load it to a cube, join it with other data or export it to another data source. Aside from the prediction values, the transform will also give accuracy values for each algorithm used. The Data Preview example below shows the churn class prediction (1.0 or 2.0) as well as the accuracy for a few algorithms used. Not shown are the other dimensions (CustomerID and others) used in the input/output source. Do not use the input source as an output source, as the input data may be replaced if the transform is followed by a cube load. |
| Output Time dimension | The name of the time or unique identifier dimension where you would like result values stored. |
| Output Version dimension | The name of the version dimension where you would like the result values stored. |
Parameters - Classification
The Function parameters are preset by the choices you made in the above setting.
| Function Parameter | Description | ||||||||||||||||||
| AlgorithmType |
|
||||||||||||||||||
| OptimizeParameters | 0 | ||||||||||||||||||
| Normalize | False | ||||||||||||||||||
| ClassWeight | Used to estimate class weights for unbalanced datasets. Balanced is the recommended setting, which automatically adjust the weights for each class based on their frequency, helping to improve the model's performance on the minority class. Alternatively, you can use None, where the class weights are uniform, or create a dictionary where the keys are the classes and the values are the corresponding class weights. | ||||||||||||||||||
| FixRandomState | True | ||||||||||||||||||
| ListOfMeasures | A list of all measures used in the data set, comma delimited. | ||||||||||||||||||
| TargetVersion | Element name in Version dimension in which you would like results populated, e.g. Prediction | ||||||||||||||||||
| TargetMeasure | Measure to be analyzed / dependent measure, e.g. Churn. |
 DriverSelectionClassification
This function can solve classification problems where the goal is to predict the category or class that a data point belongs to, instead of predicting a numerical value, as is the case with standard DriverSelection.
Choose "DriverSelectionClassification" in the Function field. Starting with the function field will ensure you see the appropriate fields and parameters to select for each respective function.
Settings
| Input source |
Input source is an extract/transform containing Time (or unique identifier) and Version dimensions. The input for Classification function must be denormalized, so a cube extract on its own will not work. The input source is a denormalized set of data that includes all dimensions and measures that are important to the classification data set as well as values for the target, the class you want to predict, e.g. Churn. Note: Do not use the same source for both input and export, as the input data may be replaced if the transform is followed by a cube load. |
| Time dimension
Version dimension Measures dimension |
The dropdown lists contain column names from the input source. Time and Version can have variable or constant inputs. The Time dimension can also be a unique identifier of each row as well, for example CustomerID. The Measures dimension should be disabled for Driver Selection Classification. If it is not, ignore it. |
| Values |
This option should be disabled for Driver Selection Classification. If it is not, ignore it. |
| Function |
DriverSelectionClassification: performs basic pre-processing (if required) on input data and identifies the important input features with respect to a given target. This function can solve classification problems where the goal is to predict the category or class that a data point belongs to, instead of predicting a numerical value, as is the case with standard DriverSelection. |
| Period | This option should be disabled for Driver Selection Classification. If it is not, ignore it. |
Parameters - DriverSelectionClassification
The Function parameters are preset by the choices you made in the above setting.
| Function Parameter | Description | ||||
| AlgorithmType |
|
||||
| Normalize | False | ||||
| FixRandomState | True | ||||
| TargetMeasure | Measure to be analyzed / dependent measure, Measure to be analyzed / dependent measure, e.g. Churn. | ||||
| ListOfMeasures | A list of all measures used in the data set, comma delimited. |
Because there is no output source, from here you can transform your data as you would like in order to, for example, load it to a cube, join it with other data or export it to another data source. Depending on the algorithm type, the output will be different. Below is an example of a Data Preview with the AlgorithmType 3.
This shows the significance level of each feature (the higher the number, the greater the significance of the driver) and the importance values (the closer the driver’s value is to 0, the more important it is).
Updated July 3, 2025
