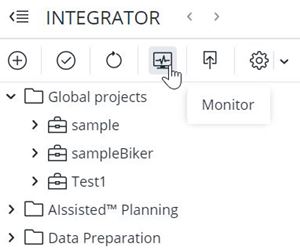
The Integrator Monitor provides information about recently executed jobs and loads. To open the Monitor, click on the icon in the Integrator navigation pane, as indicated below:

After the execution of an Integrator (ETL) job or load, the following essential runtime information can be reviewed:
- Execution ID
- Start time (UTC +user's time zone)
- Duration
- Status
- Log messages
The screenshot below shows a sample runtime report for the job "Cubedata". The top area of the Monitor shows the execution list; the list at the bottom shows the execution log.


The times in the execution list (as well as the filter controls there) use the local time of the user, i.e., the time on the machine where the web browser is running. This is indicated in the "Start time" column by the notation UTC +user's time zone. The times in the execution log use the server time, which may be different from the browser time. Note that times in older job executions don't change if the server timezone is changed after the execution. For details, see Time Zones in Jedox.
More detailed information at the component level (i.e., extracts, transforms, loads) can be obtained through execution detail monitoring. This can be helpful for performance analysis of complex Integrator jobs. To view runtime details,


- Output calls: shows how many times data of the extract or transform is requested from subsequent components (transforms or loads)
- Input calls: shows how many times data of the sources of the transform or load are requested during the processing of this transform.
Example: For many transforms like FieldTransform, both calls are always identical. A TableAggregation transform used in 2 loads that are included in 1 job will have 2 output calls but only 1 input call, because implicit caching of the source is performed.
Note: the analysis of execution details is also available via the Jedox Integrator Command Line Client (CLI).
The runtime data can be returned either in tabular or graphical form, as described in the sections below.
Execution runtime details in tabular form
A CSV file can be generated with additional runtime information on the execution of each component (using ";" as delimiter). The following information is available:
- Component name
- Runtime in seconds
- Runtime in % of total runtime
- Number of input calls
- Number of output calls
- Number of input rows
- Number of output rows
For extracts, the number of input calls and rows is always 0. For loads, the number of output calls and rows is always 0.
To generate the CSV file, click on the Tabular tab in the Execution Runtime Details window, as indicated below:

Then click on the Export Data button in the upper-left corner. A CSV file will be delivered to your default download location.
To export the data as a CSV file, click the button indicated below:

Execution details in graphical form
A flow graph of the Integrator project can be generated with additional runtime information on the execution for each component. This SVG (Scalable Vector Graphics) file can be opened with any browser.
To generate the flow graph, click on the Graphical tab in the Execution Runtime Details window, as indicated below:

Available information:
- Component name
- Runtime in seconds
- Number of calls
- Number of rows
For extracts, the number of calls and rows signifies the number of output rows. For transforms the number of calls and rows signifies the number of input rows.
Below is a sample graphic:

Updated July 3, 2026